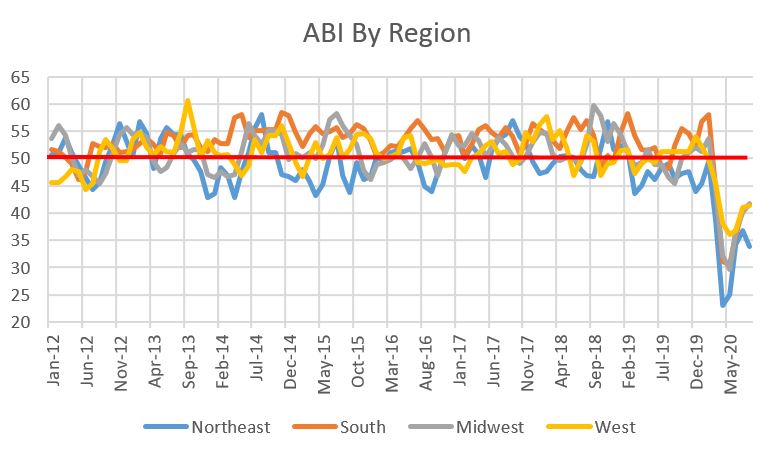
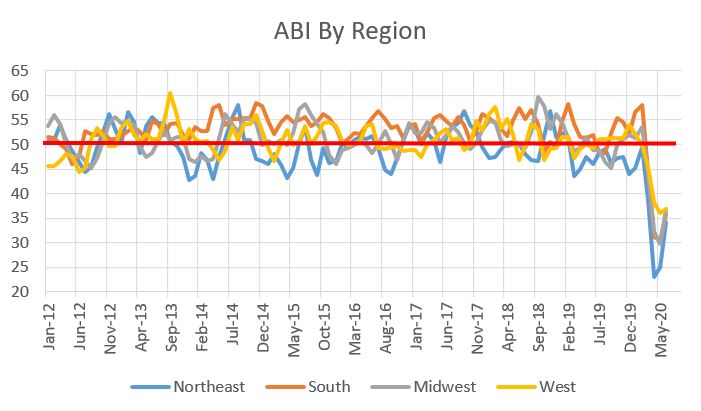
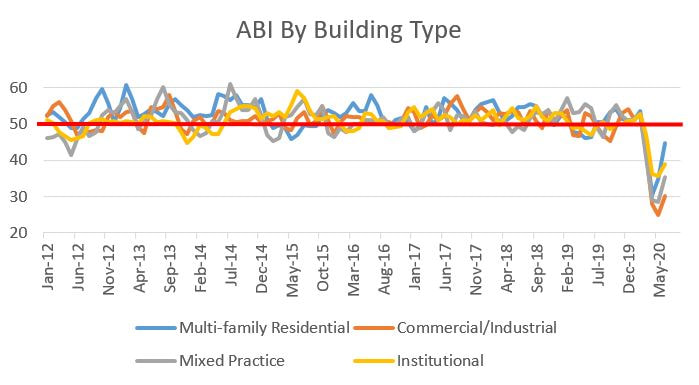
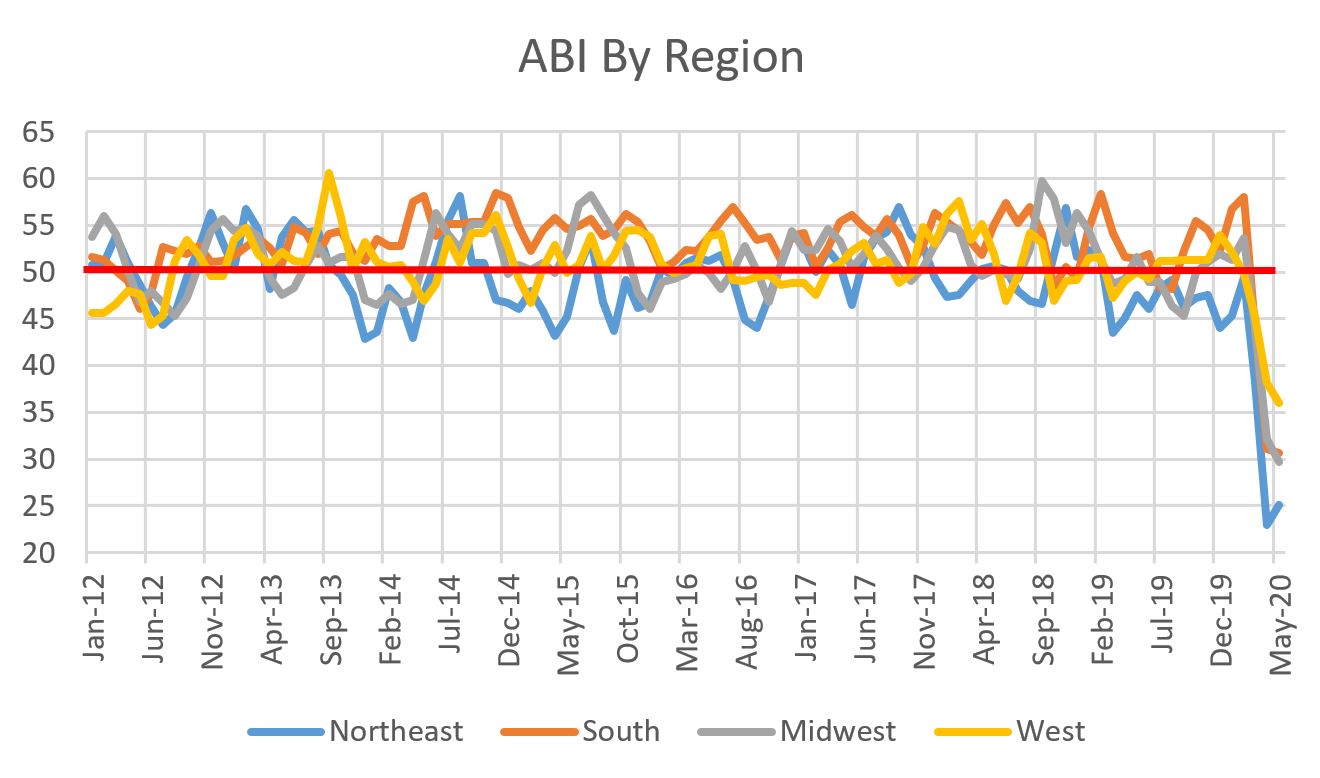
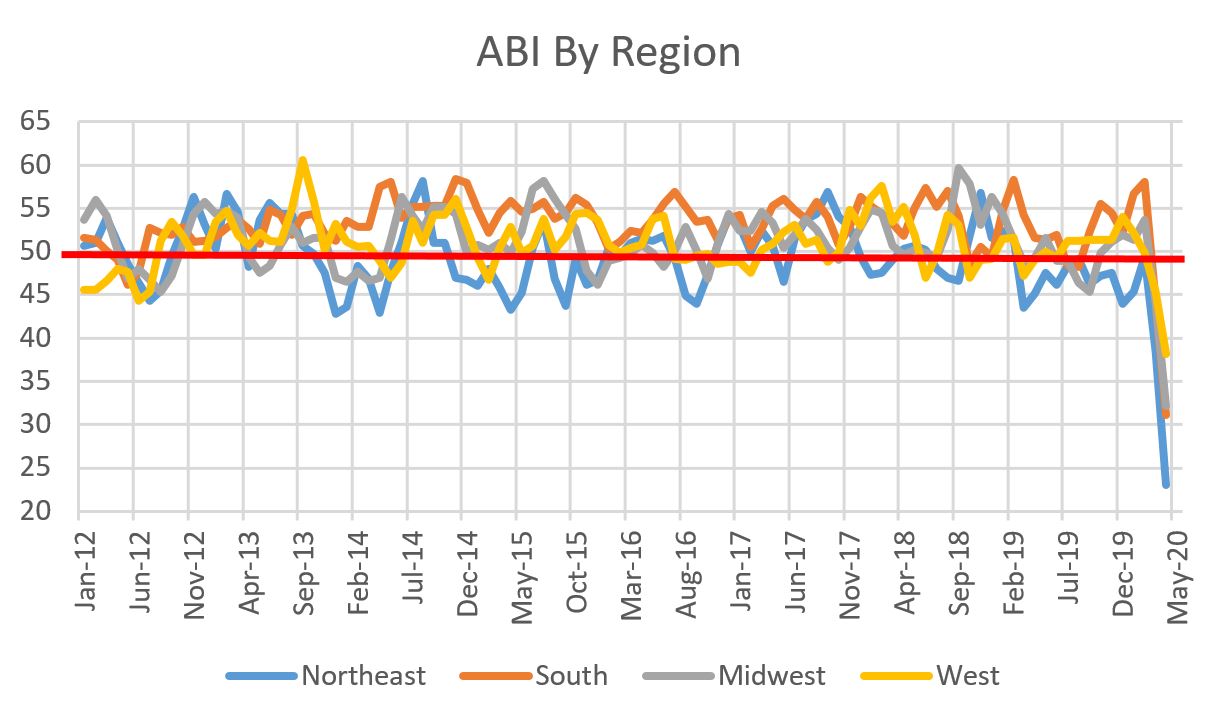
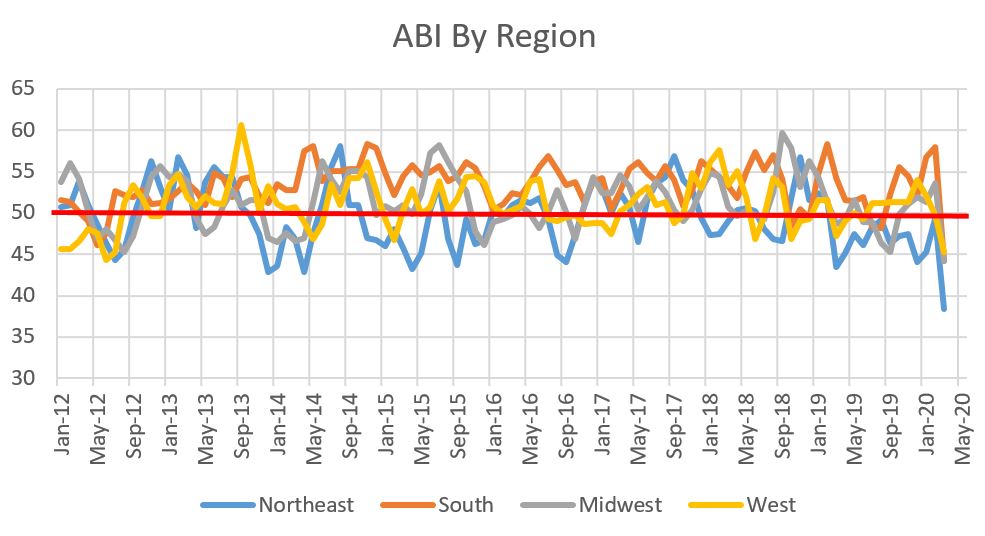
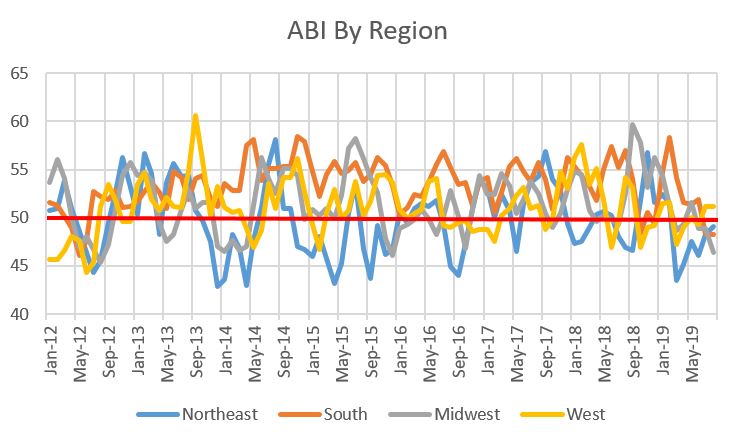
Construction Industry Update: Architecture Billings Flat While Contractor Backlogs Increase9/23/2020 We're three quarters into the month which means it's time to take a look at some economic indicators for the construction industry. Let's start with the leading indicator, the American Institute of Architect's Architectural Billings Index (ABI). As a refresher, the ABI is a leading indicator of commercial building construction by approximately nine to 12 months. A value greater than 50 means that architecture billings are increasing; any value less than 50 means billings are decreasing. For the third month in a row, the ABI checks in at 40. Still decreasing but at least it's holding steady and up from the low of 29.5 in April. 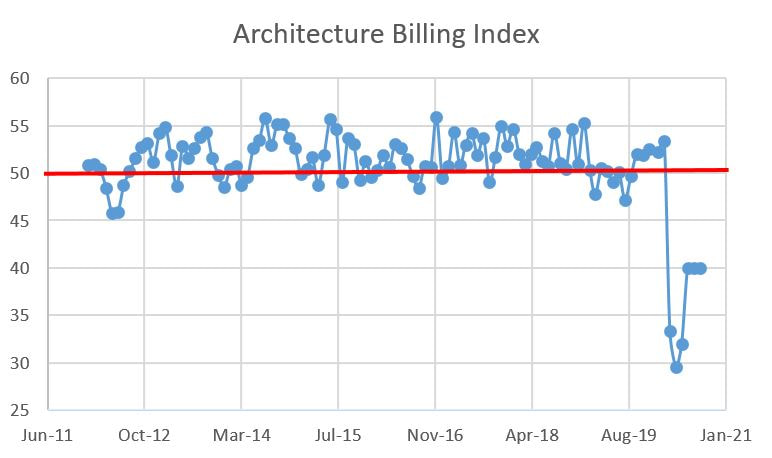 Project inquiries climbed over the 50 hurdle, but recall that inquiries basically represent people interested in projects, not those starting them. Still, we'll take good news however it comes. 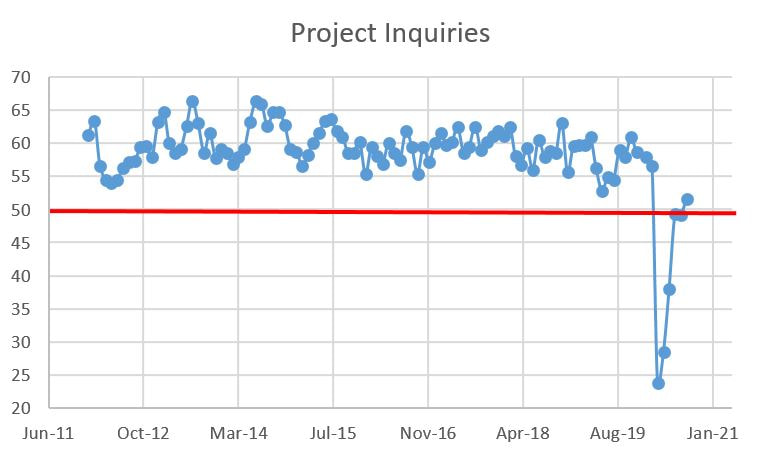 The regional data shows modest increases with the exception of the northeast which turned south after four months of increases. The northeast has consistently lagged its peers. The breakdown for each region is as follows:
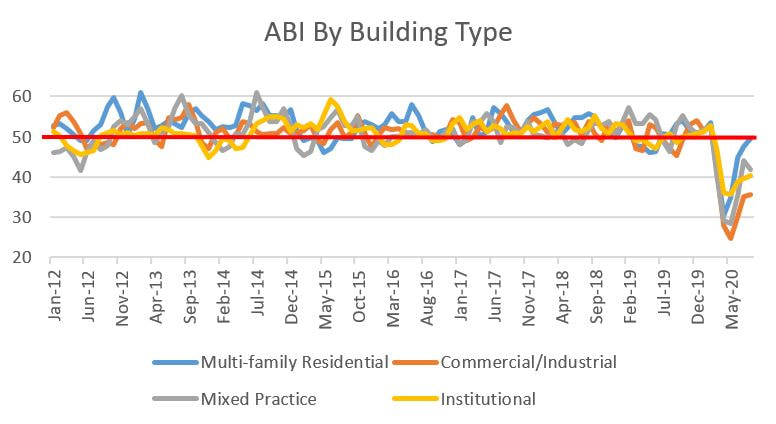
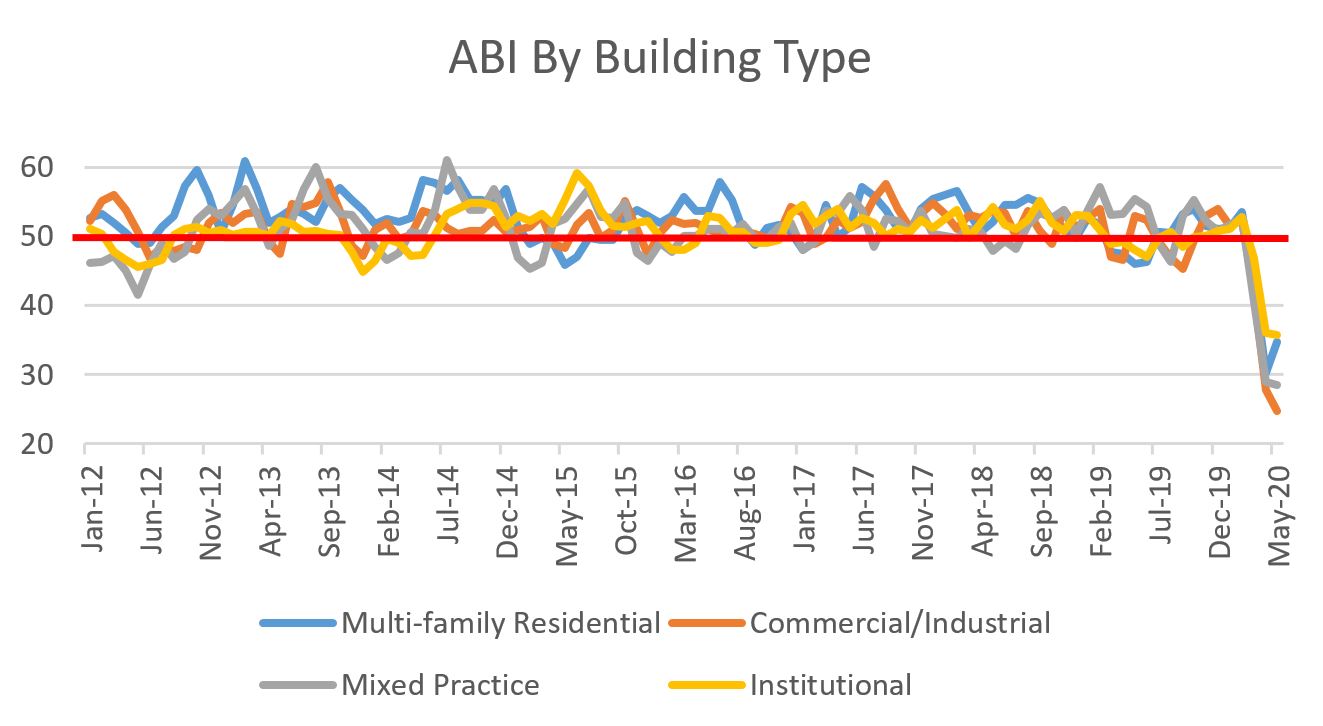
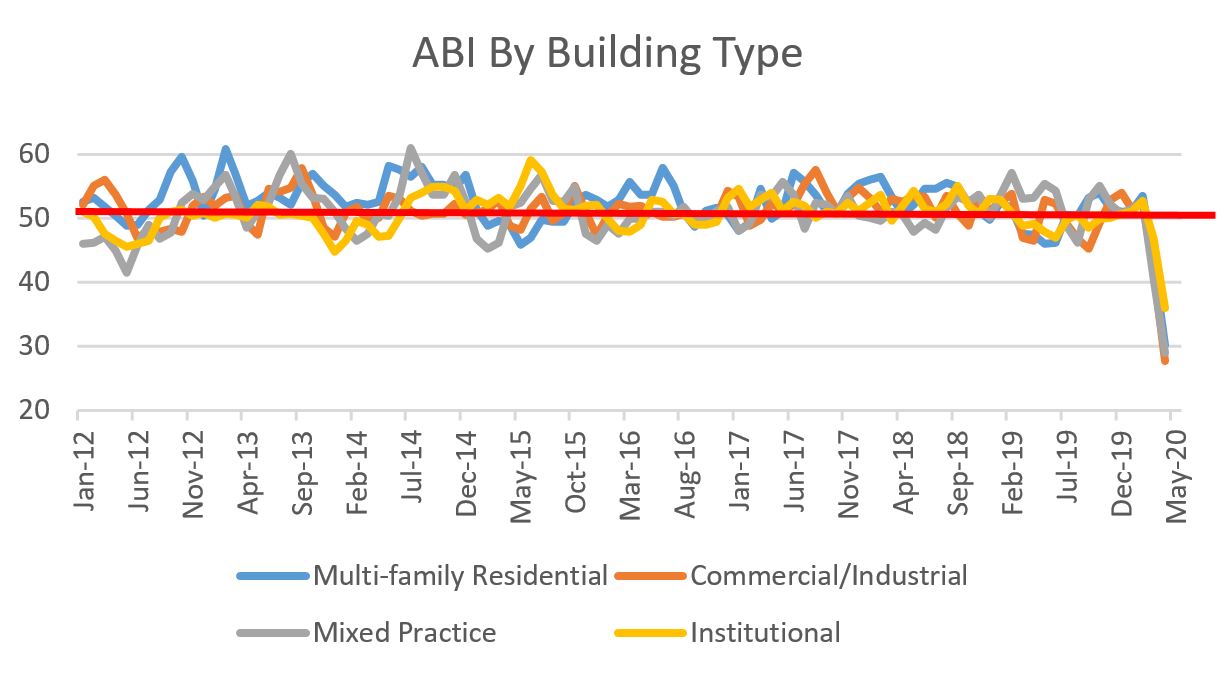
 By building type, multi-family continues to be the best performing sector, albeit while still having declining billings. Mixed-practice was the only decliner. The August stats for all are:
 Switching gears from designers to contractors, a bright spot, albeit small, is that contractor backlogs, as reported by the Associated Builders and Contractors, increased last month. The data below is quarterly so the trends still look negative, but we also have one month remaining in Q3 so we may see these curves invert in the right direction next month. Contractors now have an overall backlog of eight months in August, up from 7.8 months in July. 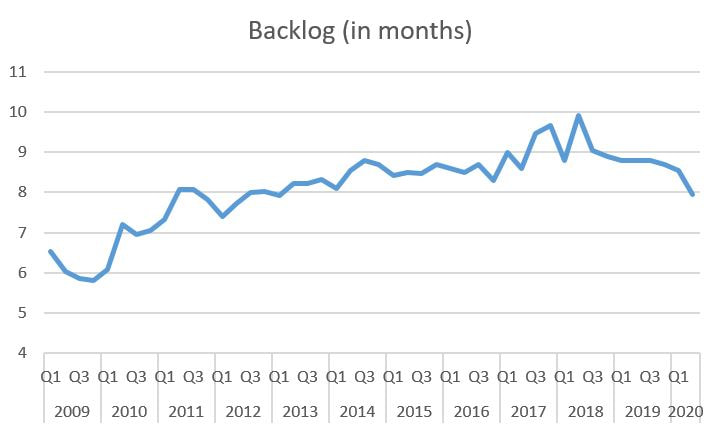 The details are a bit choppy. Let's start with the details by industry sector for August:
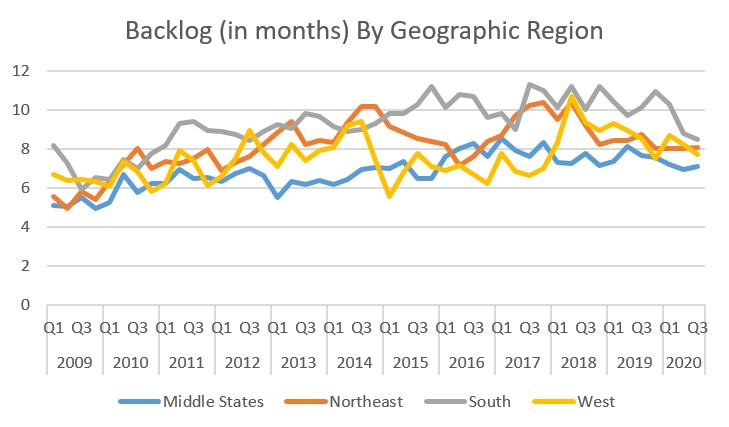
 For geographic region, the data is also choppy with bright spots even though the quarterly curves below trend downward. The details are as such:
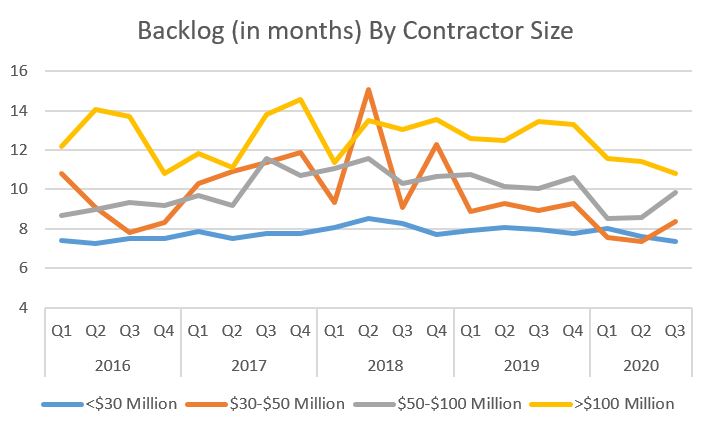
 Lastly, the backlog by contractor size is below. The month-to-month data includes some relatively large extremes:
 It's not bold to predict that there could be some more turbulence ahead with election posturing, a possible resurgence of COVID-19 as students return to work and the western states on fire, but in these anxious days, the ABI not decreasing and contractor backlogs increasing, even slightly, isn't too shabby.
0 Comments
Over the past few weeks, the demo and site work packages have been going full speed at the Sac State WELL building. I'll do a more detailed write-up later, but the short version is that the building will be expanded on two sides (the loading dock side and the University's Health Center side). The pix below are sure to be the first in many I will be posting over the next year.  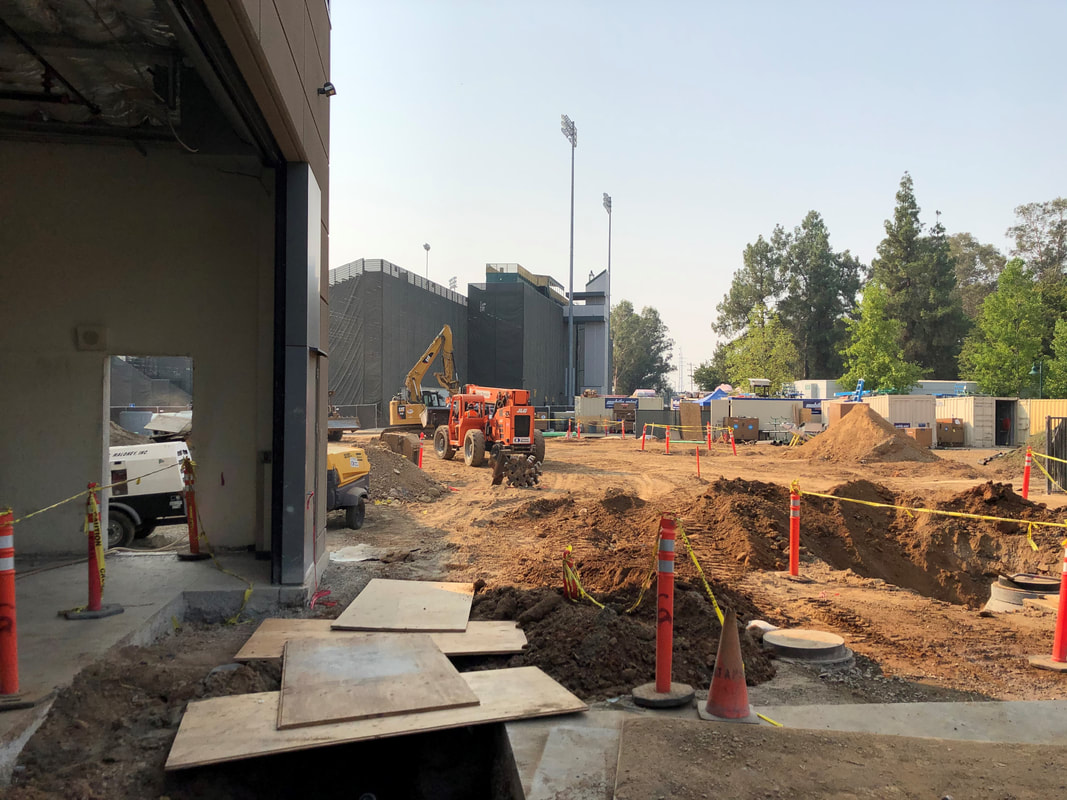 Demo and site work at the rear (loading dock) side of the building. 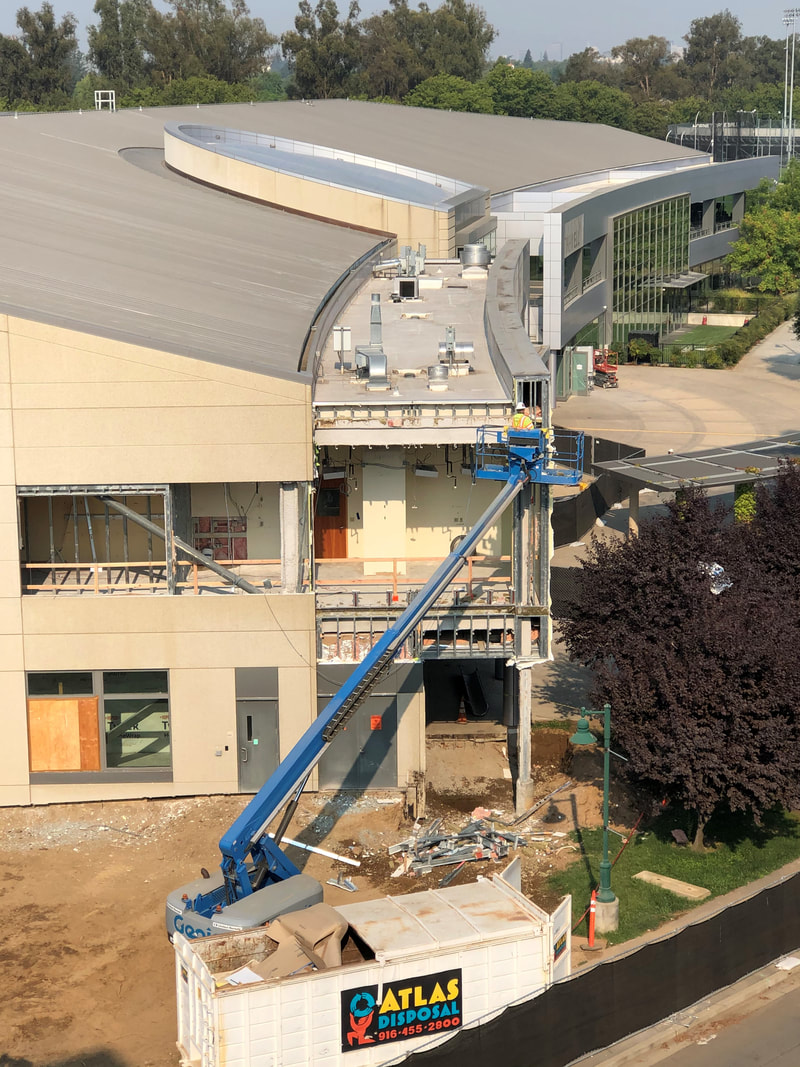 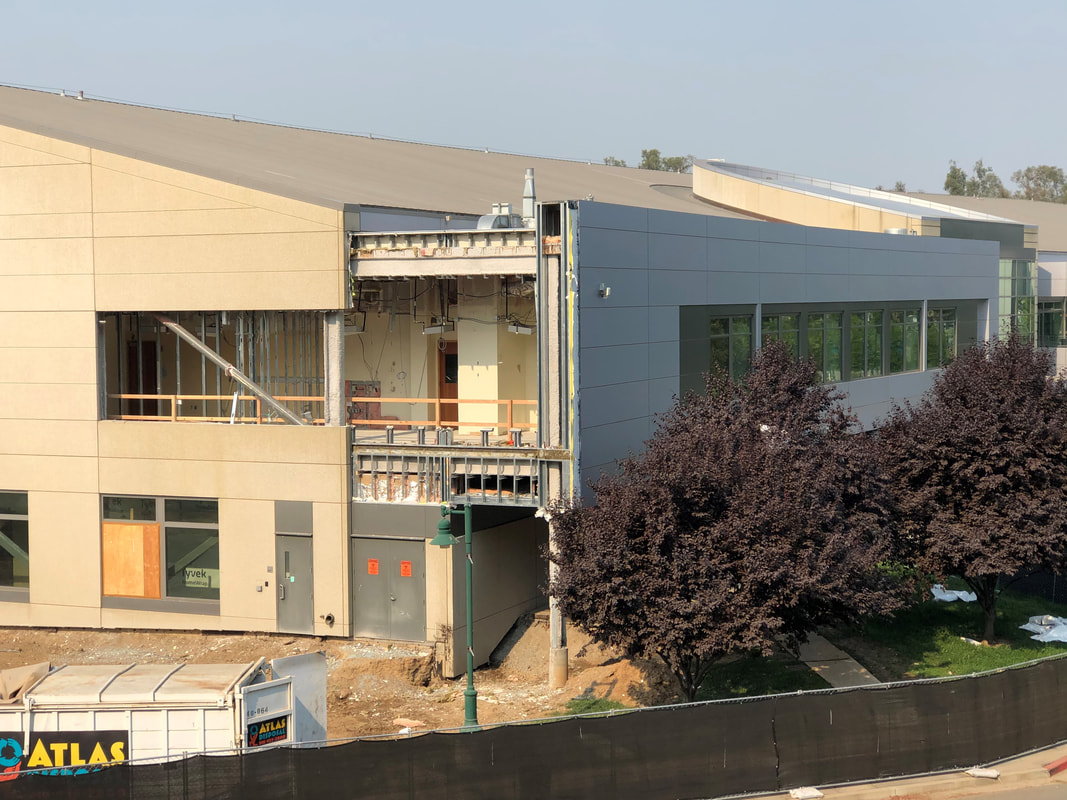 Selective demo on the building envelop on the Student Health Center side or the building. This side will be extended outward. 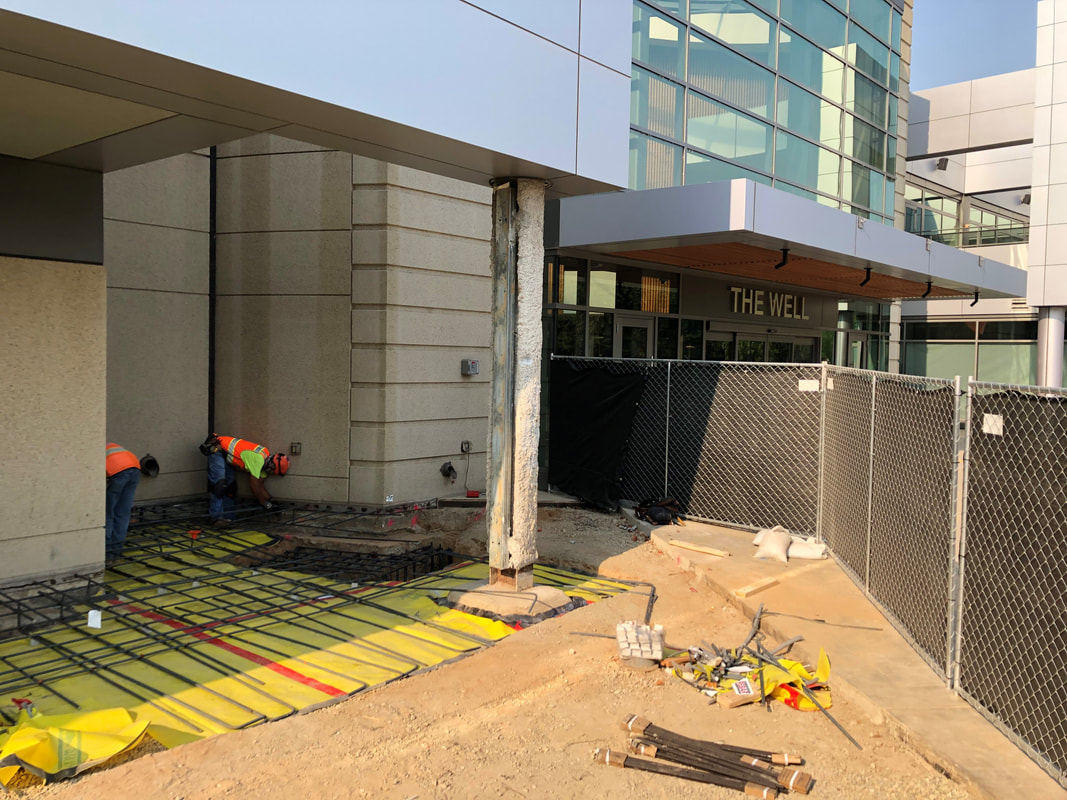 Replacing some concrete. This area will be receiving a new stairway to improve egress.
Today in Sacramento, it's supposed to get to 106 degrees and the air is unhealthily thick with smoke and ash from wildfires and I say to myself, "well, it cannot get any worse." It's 2020. Of course it can. First came the news that infrastructure project starts fell 31% in July. While the article goes on to say the news isn't all bad, it's hard to casually move past the nosedive, even for a month, of a major component of the overall construction market. Particularly when it is the same infrastructure that almost everyone, even political cats and dogs who concur on almost nothing, agree we should be providing more money towards. Combine this drop with the decrease in contractor backlogs and confidence in July and it is hard to see the silver lining. Because it is that time of the month, I decided to check on the American Institute of Architect's Architectural Billings Index (ABI) to see what our favorite construction leading economic indicator is up to. Sure enough, the July figures were released this morning. Before the big reveal, it is important to note that the ABI is a leading indicator of commercial building construction by approximately nine to 12 months. A value greater than 50 means that architecture billings are increasing; any value less than 50, as is the case for the past few months, means billings are decreasing. For July, the song remains the same, with a repeat of June's 40 figure. But hey, it's not falling! 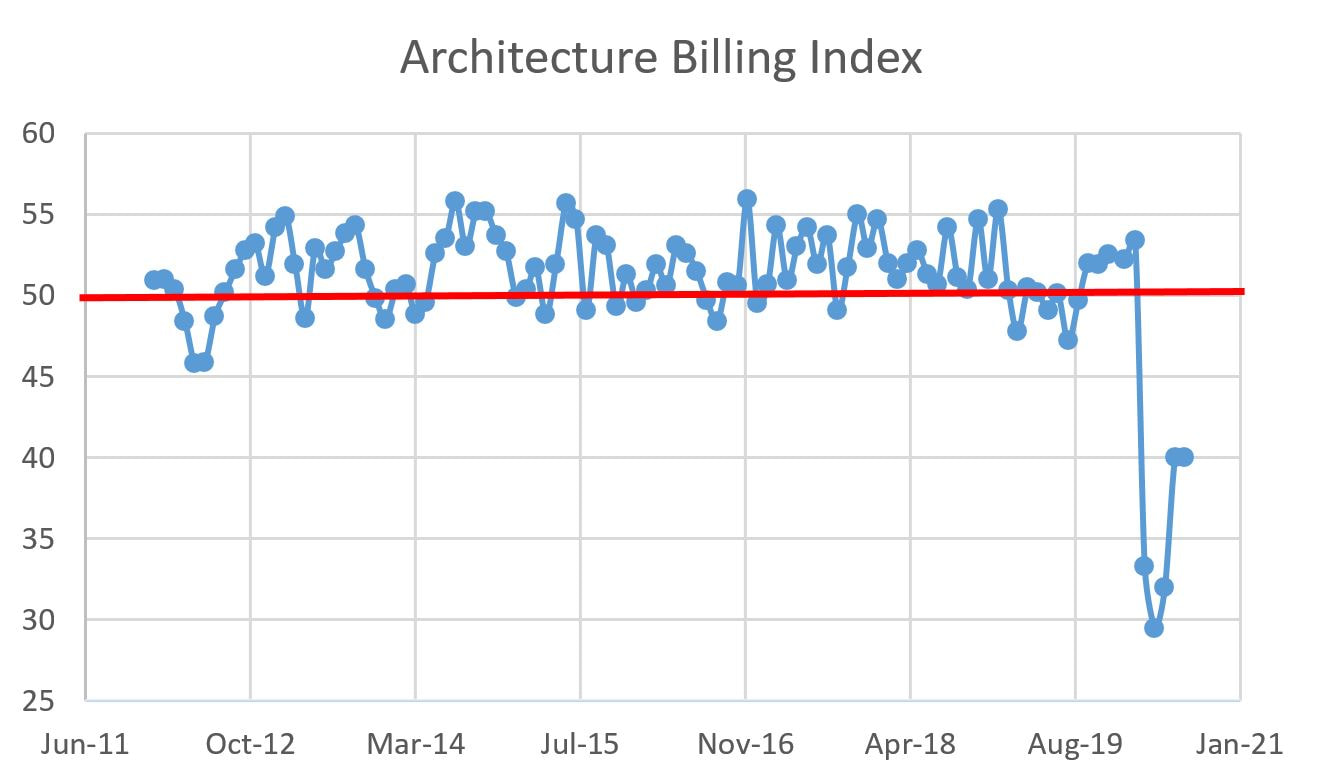 Next month's results will be very interesting. In June I was concerned with a dead cat bounce. A downward trend in the August ABI may hint to that, while, conversely, an increase may indicate we are climbing out of the hole, albeit with fits and starts. My curiosity, having kicked into high gear, led me to dig into some AIA data I have never shared in this blog. The first figure shows data for project inquiries. 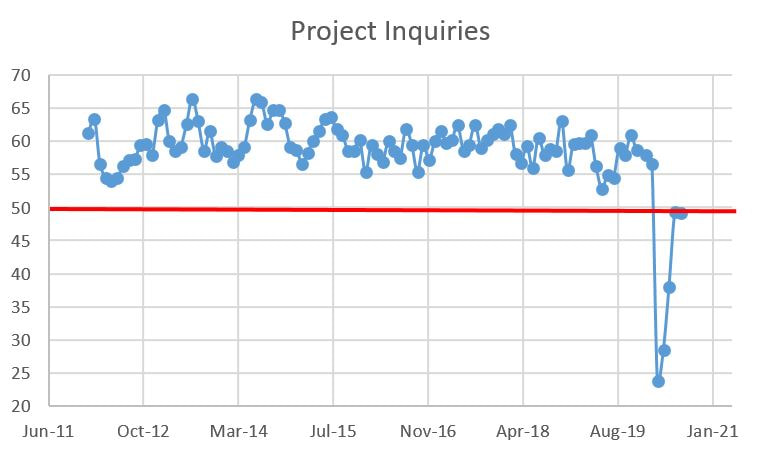 Inquiries are almost to 50, yet inquiries are just that: people kicking the tires on potential projects. Don't get me wrong, the trend is certainly positive but it doesn't measure any commitment on the part of owners to start projects any more than test driving a car indicates a commitment to buy. The better figure for gauging that is for design contracts. As luck would have it, AIA tracks that as well. 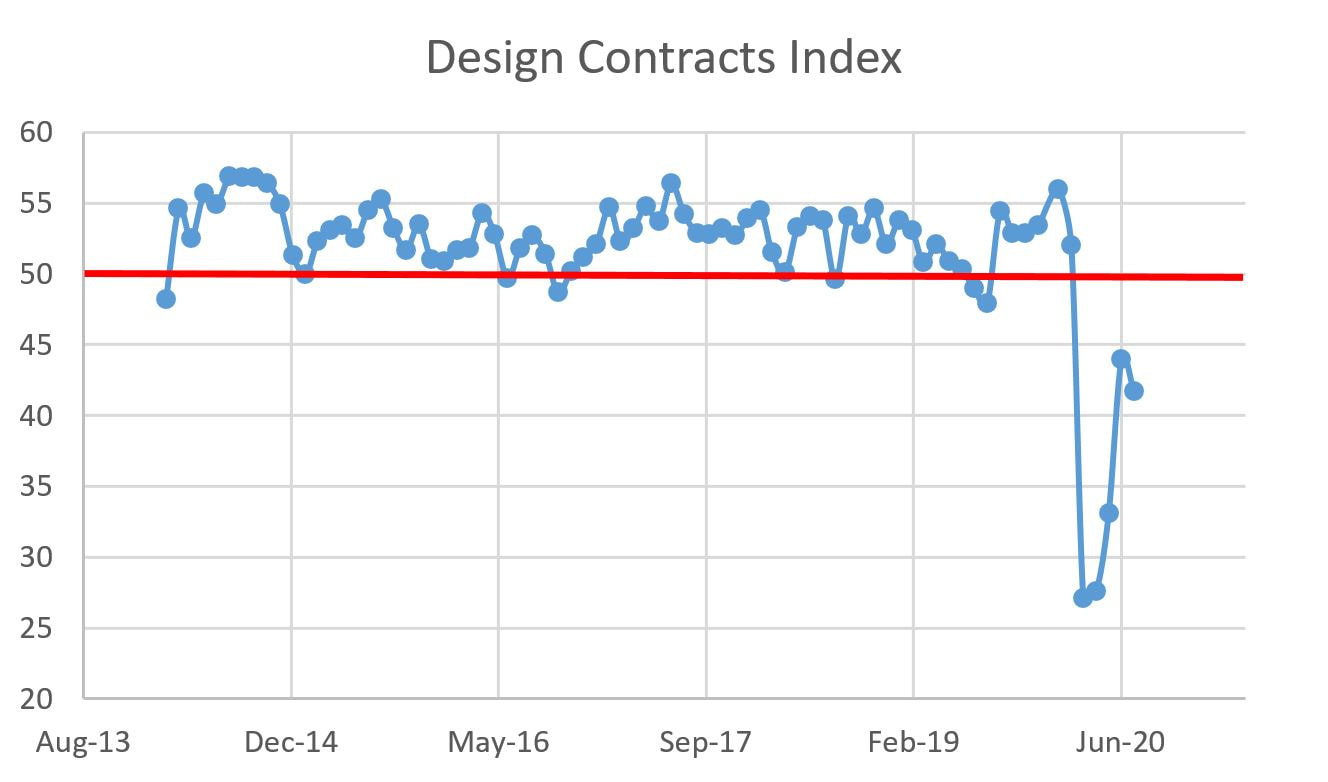 That's where the luck ends. The rate of new contracts actually declined, from 44 in June to 41.7 in July. Design contracts are a leading indicator of billings (leading indicator on leading indicator), so there's an argument to be made by the pessimists that we are in for rockier times. We shall see. For the regionals:
 The Sector Averages for July 2020 are as follows:
Some economic indicators are up, others down (sharply in some cases) and a whole lot of let's-see-what-happens-next-month. In other words, your daily reminder it's 2020. Let’s start with architecture billing. I smell a positive trend! The American Institute of Architects (AIA) Architecture Billing Index (ABI) is continuing to rebound, posting a 40 in June, up from 32 in May and 29.5 in April. While the trend is good, let’s not forget that 40 is still pretty lousy. As a reminder, ABI is a leading indicator of commercial building construction by approximately nine to 12 months. A value greater than 50 means that architecture billings are increasing; any value less than 50 means billings are decreasing, which is the case for the past four months. The overall ABI is as follows: 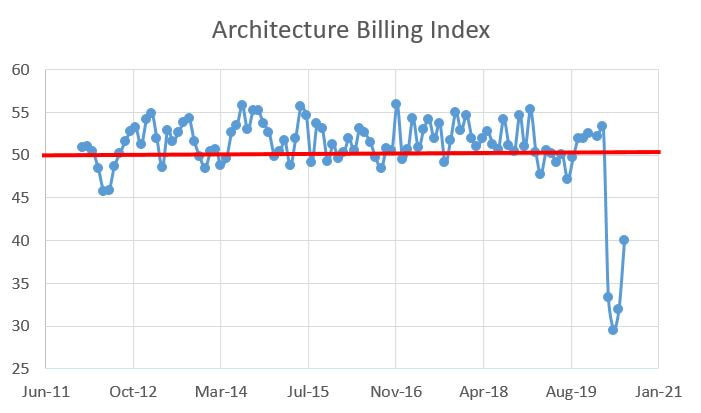 Still, up is up and it seems the AEC industry is starting to adjust to a COVID-dominated world. As for the regional breakdown:
 The Sector Averages for June 2020 are as follows:
 So on the one hand, we are clearly numerically up from the lows experienced in April. On the other hand, the scores are below 50 across the board, demonstrating that billings are shrinking (just not as fast). How about contractor backlog? If the ABI represents what may happen in about a year (the hope), then what do contractor backlogs (the promise) look like? The graphs below show a decrease in contractor backlogs, but the x-axis is in quarters. The good news is that, according to the Associated Builders and Contractors, collectors of the backlog data, backlogs increased last month and optimism is rebounding. 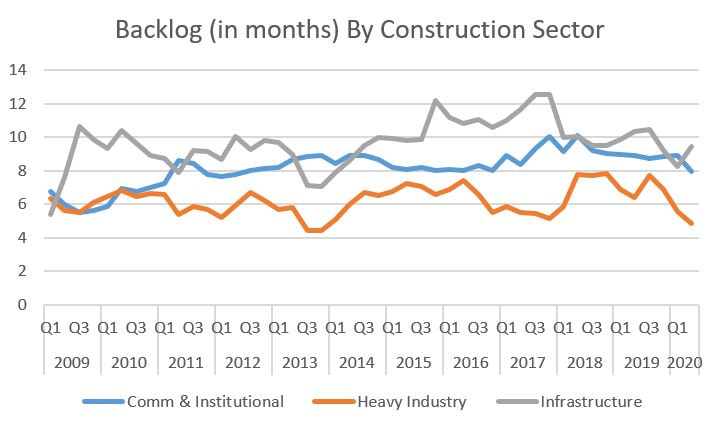 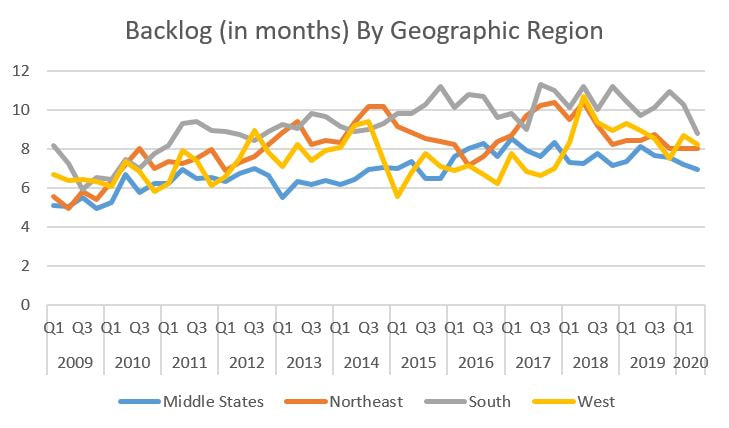 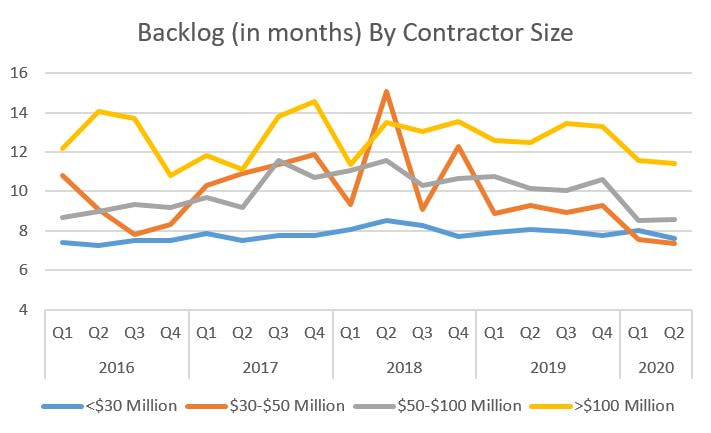 Backlogs are down considerably from their peaks, but what’s missing (and possibly smoothed out due to the quarterly vs. monthly data) are the huge drops we witnessed in the various ABI measures. I don’t know this for a fact, but I highly suspect that this is due to the relative ease of canceling (or not starting) design as opposed to the relative difficulty in terminating projects, particularly large projects (notice the line for $100 million + projects is consistently higher than others) once a general contractor is selected. This is particularly the case for public-sector projects, many of which take years to get approval from and once funds are allocated, they are typically locked in place (infrastructure, which is commonly publicly-financed, actually increased its backlog last quarter).
All in all, we seem to be off the bottom and it doesn’t appear to be a false bottom (fingers crossed). I speculate that the ABI figures will remain under 50 as we pass the COVID-19 economic kidney stone, but any climbing towards 50, no matter how tiny, will help the AEC industry weather this storm. It is Friday, so let's start with some good news: the American Institute of Architects (AIA) Architecture Billing Index (ABI) rebounded from last month's beyond dismal 25.1 figure up to 32 for May 2020. The bad news: 32 is still pretty bad (OK, it sucks...). Hopefully this is a turn in the right direction, though. As a reminder, ABI is a leading indicator of commercial building construction by approximately nine to 12 months. A value greater than 50 means that architecture billings are increasing; any value less than 50 means billings are decreasing, which is the case for the past few months. The overall ABI is as follows: 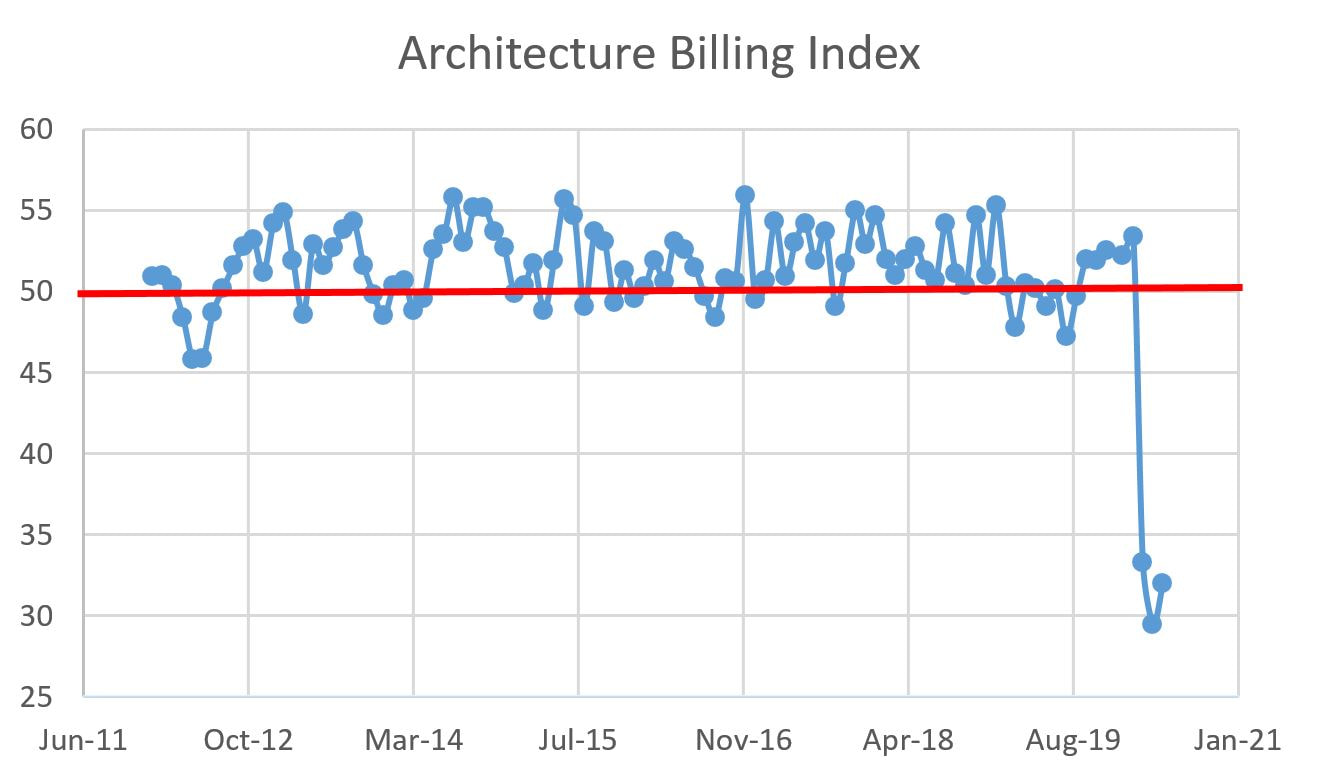 Notice the sharp uptick in May. Hopefully it is not a dead cat bounce. As for the regional breakdown:
 The Sector Averages for May 2020 are as follows:
 It is unwise to call a trend based on the two most recent monthly data points, so I will just state that I hope that the bottom has been reached. Given the uptick in COVID-19 cases in the South, the region that has been the strongest in the construction industry for much of the past decade, I am worried that we are still far away from a V-shaped recovery in construction in spite of pent up demand.
Yup, two blog posts in one day. With the taxes I pay on the income that comes from delivering these pithy insights, the economy will be back in no time! So I like to present the AIA ABI data as a leading indicator of where the construction industry is heading, but it is just a proxy for the construction industry. Let's take a minute to discuss a metric that is directly related to the construction industry. It so happens that the Associated Builders and Contractors (ABC) has such a metric: the Construction Backlog Indicator (CBI). What if the CBI presents a better picture that the ABI? Maybe things are not that bad. Well...they are not great. The CBI is the number of month's worth of work under contract. The numbers have been falling since January. While ABC provides monthly data, I have some questions about the data. ABC typically reports a month's data approximately 1.5 months later, so January data would be reported mid-March. However, April's data was presented in in May. Also, and even more puzzling, the reported data for February and March 2020 are exactly the same. This is all inside baseball, but I have rolled the data up into quarterly results instead of monthly. But back to the results. January showed an average backlog of 8.9 months. The "April" values released last week showed an average backlog of 7.8 months. While 1.1 months may not seem like much, it is a drop of over 12%. 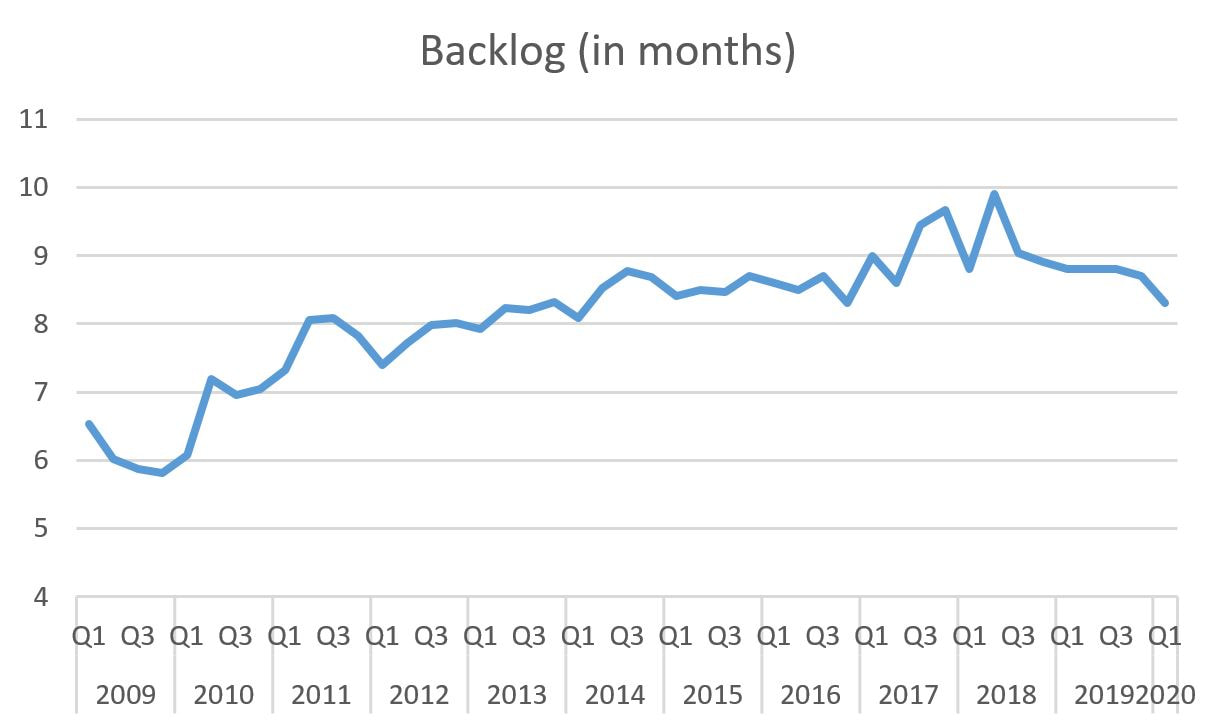 2017 and 2018 were spiky but pretty good. But in mid-2018, backlogs began to slide and the first quarter of 2020 they began falling. The ABC data allows for some drilling down. In terms of industry sector, backlogs have been falling since the second half of 2019 and accelerating for the heavy industry and infrastructure sectors in the first quarter of this year. 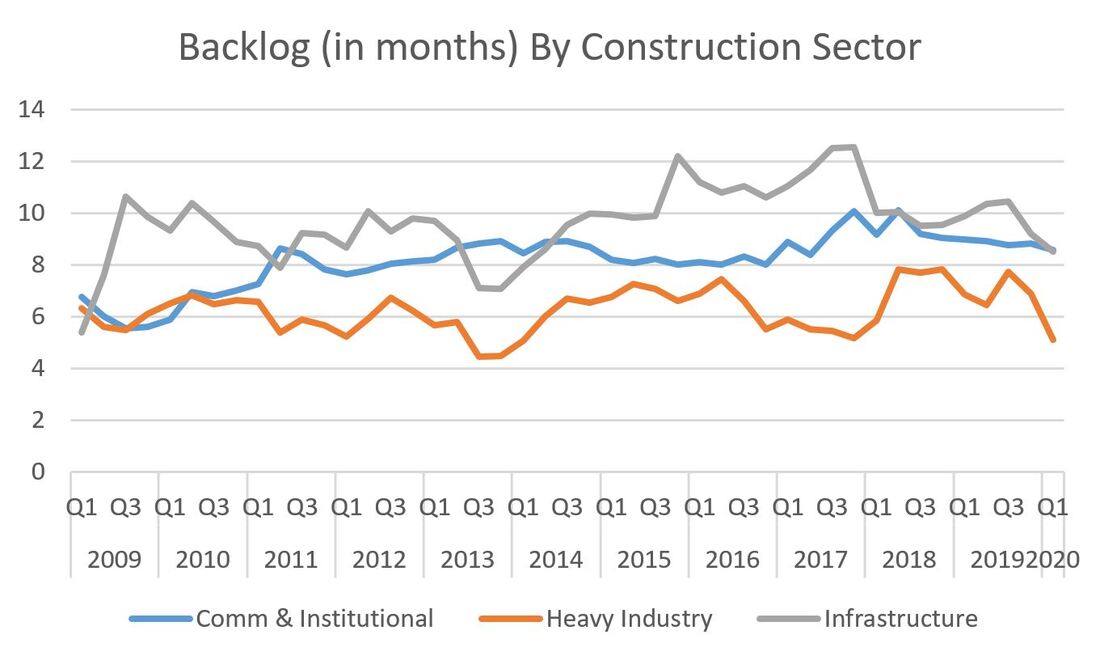 Decreases in backlogs by geographic region are far less pronounced as the data is pretty choppy. Interestingly, the West saw an increase in backlog in Q1 2020, but we will see if that continues next month. Metropolitan areas in California and Washington were hit particularly hard by COVID-related project shutdowns (which could be good or bad). 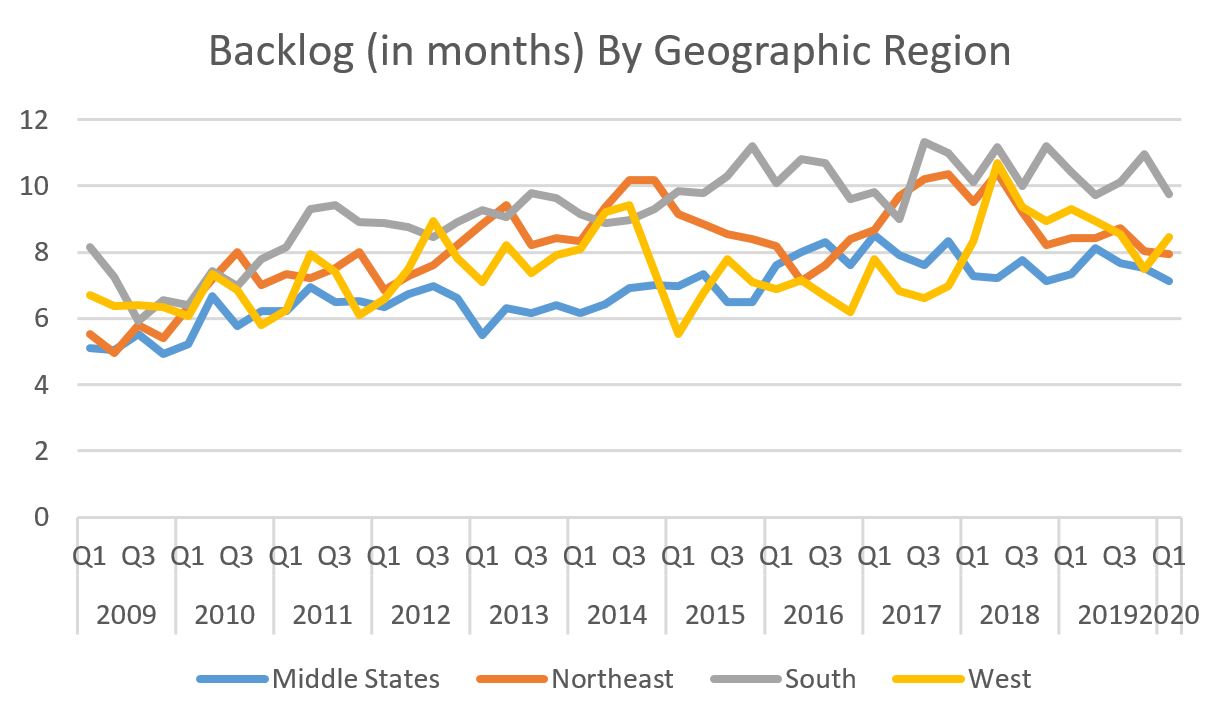 Last is a graph of backlog by contractor size (in dollar volume). Smaller contractors have been fairly consistent with approximately eight months of backlog since 2016. But all of the larger segments have seen a sharp decline in backlog since Q4 2020. 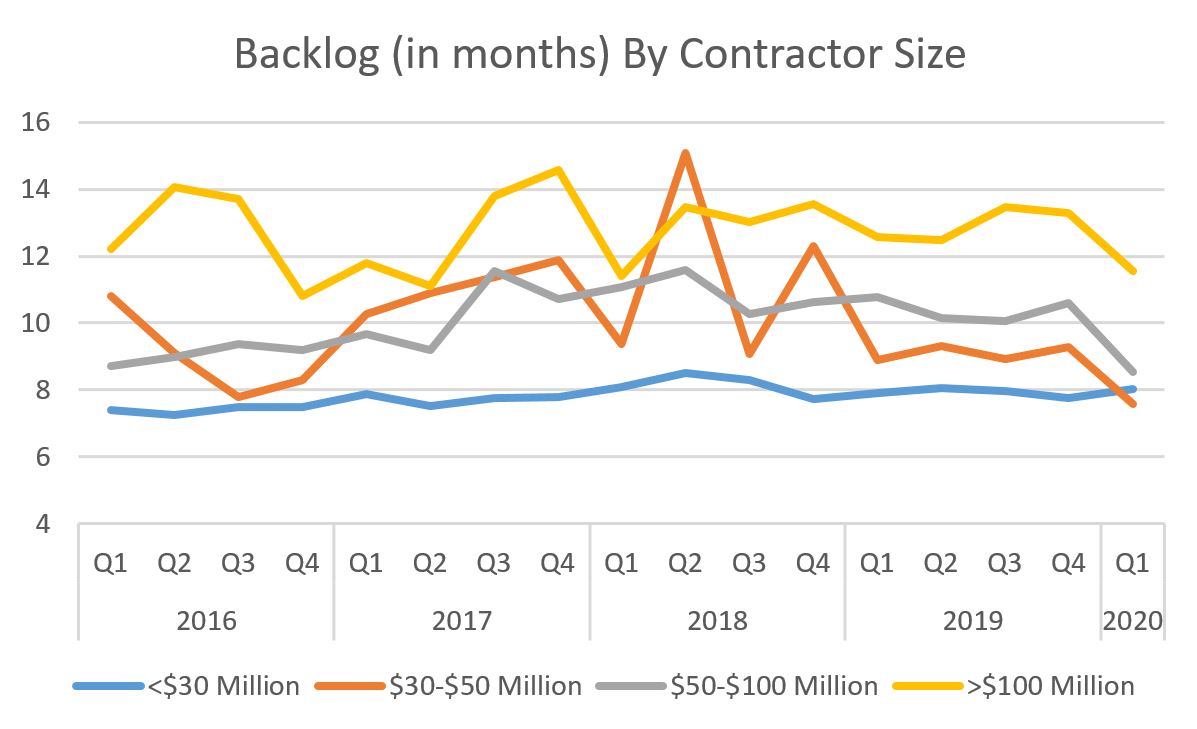 So backlogs have generally been falling since 2019 but haven't seen the perilous drop that the ABI has seen in recent months. But by combining both factors, it looks as if the construction industry started slowing in 2019 and will likely hit the skids in the second half of 2020. Not great news, but perhaps this will be enough to encourage bi-partisan efforts to fund infrastructure improvements (hey, let's try to find a silver lining somewhere).
Hey there all you cool cats and kittens (yes, I'm opening with some Carole Baskin to distract from the impending bad news). Well, the American Institute of Architects (AIA) Architecture Billing Index (ABI) had another bad month. Why do we care? Because the ABI is a leading indicator of commercial building construction by approximately nine to 12 months. Any value greater than 50 means that architecture billings are increasing; conversely, any value less than 50 means billings are decreasing. The ABI for April 2020 was (checks notes one more time in astonishment) 29.5. Sigh.... The fall from 53.4 in February to 33.3 in March was the worst fall in the index's 25 year history. April continues the plumb for new lows. 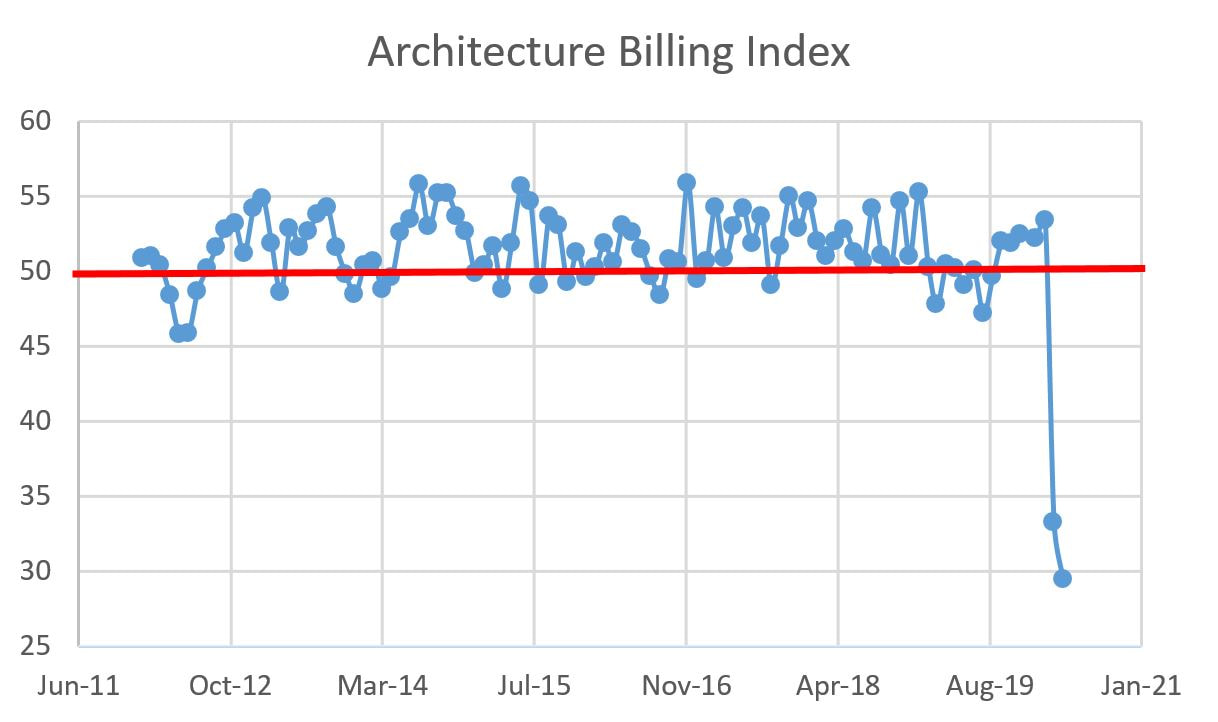 The regional breakdown for April 2020:
 The Sector Averages for April 2020 are as follows:
 I will reiterate what I said after last month's drubbing: the need for buildings, especially housing, didn't just dry up overnight. But as the likelihood of a "V" shaped recovery for the overall economy dims, it increasingly looks as if the design and construction industry is headed for hard times.
I just read my last post from September about how the AIA Architecture Billing Index (ABI) tumbled. How cute was that? The score dropped from 50.1 in July to 47.2 in August and remained below 50 by settling in at 49.7 in September. (For background, any value greater than 50 means that architecture billings are increasing; conversely, any value less than 50 means billings are decreasing. The ABI is a leading indicator of commercial building construction by approximately nine to 12 months.) The scores zoomed back above 50, peaking at 53.4 for February. Wow, that was crazy! Well, it seemed crazy until this month. Before continuing, you may want to pour yourself a stiff drink. The ABI for March fell 20.1 points to 33.3. This is the largest drop in the index's 25 year history. For reference, the largest previous drops during the 2001 and 2008-2009 recessions were 9.4 and 8.3 respectively. 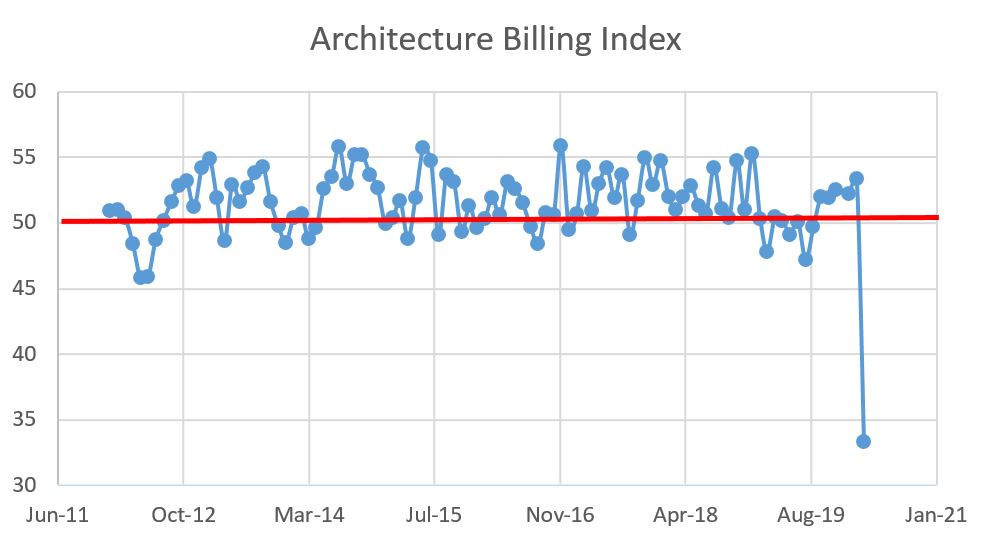 The regional breakdown for March 2020:
 The Sector Averages for February 2020 are as follows:
The need for buildings, especially housing, didn't just dry up overnight. However, given the overall health of the economy and the deep uncertainty as to the depths of the COVID-19 fallout, it will take several months for these bruises to heal, if not much longer. The American Institute of Architects issued a press release today titled "Substantial Decline in Architecture Billings" which shows that the AIA's Architecture Billing Index (ABI) fell from 50.1 in July to 47.2 in August. This is the largest drop since it fell from 55.9 in December 2016 to 49.4 in January 2017. Project inquiries dipped slightly from 54.9 last month to 54.5 yet the Design Contract Index fell from 49 in August to 47.9. Ouch...Per my usual spiel, any value greater than 50 means that architecture billings are increasing; conversely, any value less than 50 means billings are decreasing. The ABI is a leading indicator of commercial building construction by approximately nine to 12 months. Last month I wrote "The economy is slowing, but it's not slow." It appears to be slowing faster than I expected. Again, no need for a full-blown panic, awareness of a slowdown is warranted.  Here's is the regional breakdown for August 2019:
 Sector Averages for August 2019:
The graphic below is cobbled together from two indicators I like to follow and an article published today in Business Insider. On the left is the JLL office clock. It shows New York as entering the "falling phase" in terms of rents. The middle graphic is from the Business Insider article stating that NYC luxury real estate had its slowest month in six years. On the right are the AIA Architectural Billing Index results from last month (click here for my explainer). 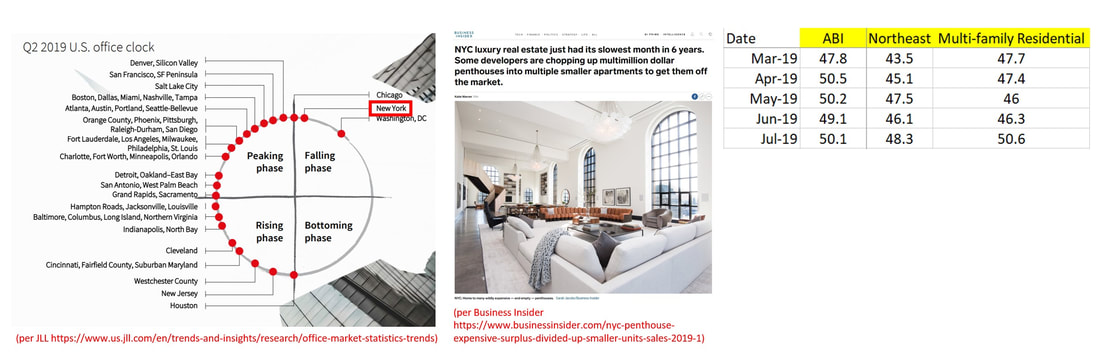 These pieces of evidence are not entirely related. The JLL clock is for commercial properties. The BI article is for multi-family properties and the Northeast ABI and Multi-family Residential ABI numbers include data that extends beyond NYC. However, if you combine them and include the recent data that reveals that New York City had a decline of commercial construction starts (which includes both commercial and multi-family projects) of 8% over the fist half of 2019 and the signs point to an almost unmistakable slowdown in NYC construction activity.
|
Archives
January 2024
Categories |
 RSS Feed