Builder blog

Current events and commentary regarding the construction industry. Opinions are my own.
Justin Reginato, Ph.D.
  • About
  • Builder Blog
  • Tacos & Tower Cranes
  • In the News
  • For CM Students

Economic Mixed Bag: Design Billings Up Two months in a Row; Contractor Backlog Down Two Months in a Row

10/23/2021

0 Comments

 
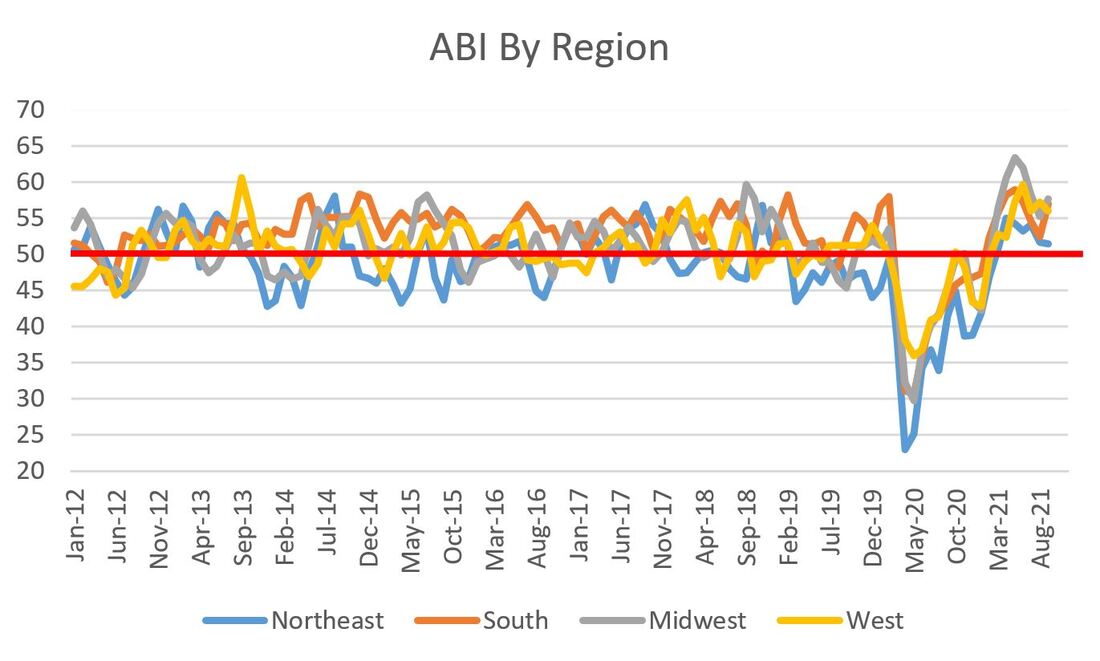
This post is a construction economics two-for-one. The short take is that architectural billings are still very robust and have increased for the second month in a row, while contractor backlogs have dropped over the same period of time. Let's dig into the good news first.

The American Institute of Architects (AIA) released the September Architecture Billings Index (ABI) this past week and the value came in at 56.6, above August's 55.6 and July's 54.6.  While the ABI is down since peaking at 58.5 in May, all of the data from 2021 are way above the average ABI, which is 50.8 since 2012. As a reminder, the ABI is a nine-to-12 month leading indicator of construction activity. A value greater than 50 means that architecture billings are increasing; conversely, any value less than 50 means billings are decreasing. 
Picture
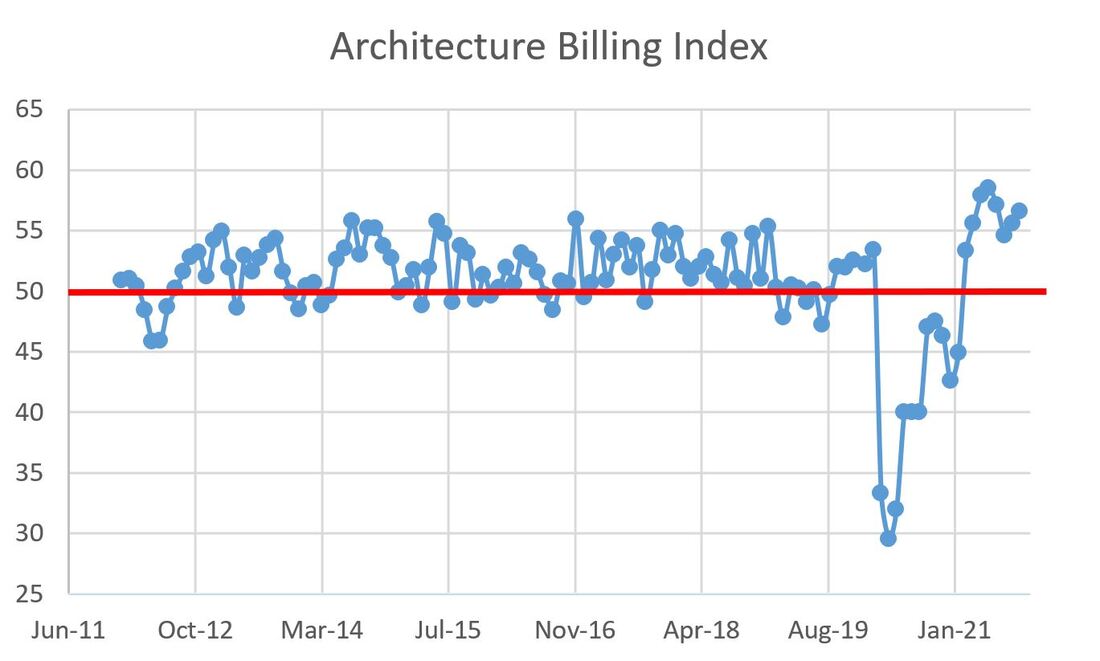
The regional ABI data is a mixed bag with two increases and two decreases:
  • Northeast: 51.5 (down  marginally from 51.7 in August)
  • South: 57 (up sharply from 52.5 in August)
  • Midwest: 57.7 (up from 55.2 the previous month)
  • West: 56 (down from 57.2 in August; the past four months in the West have been up and down)
Picture
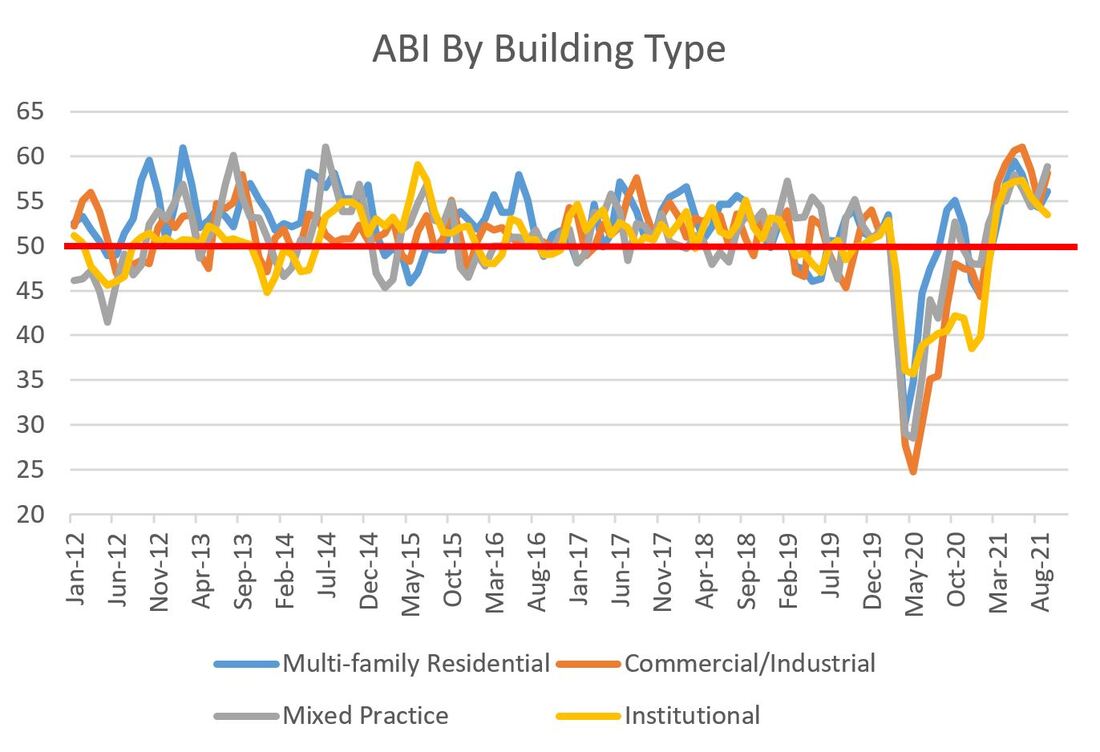
For industry sectors, gainers beat decliners three to one:
  • Multi-family Residential: 56.1 (up nicely from 54.3 in August)
  • Commercial/Industrial: 58.1 (up strongly from the previous month's 54.7)
  • Mixed Practice: 58.8 (another big monthly gain, up from 56 in August)
  • Institutional: 53.5 (the only decliner, down from 54.4 last month)
Picture
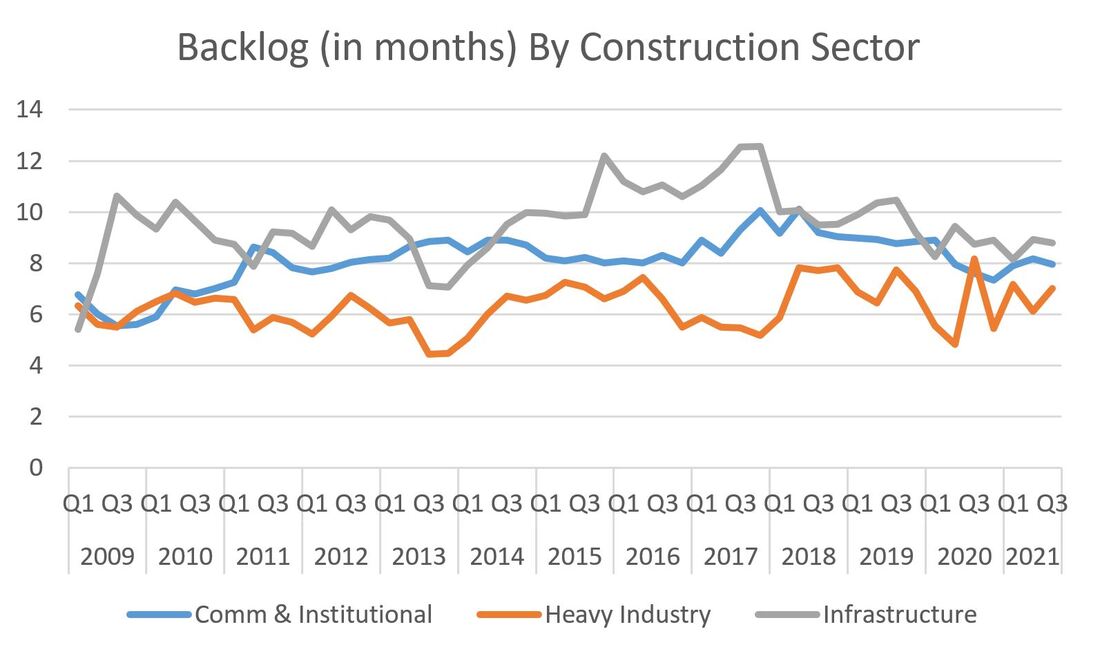
While the news is positive on the balance, one thing to keep an eye on are the four straight months of declines in project inquiries, with September clocking in at 61.8.
Picture
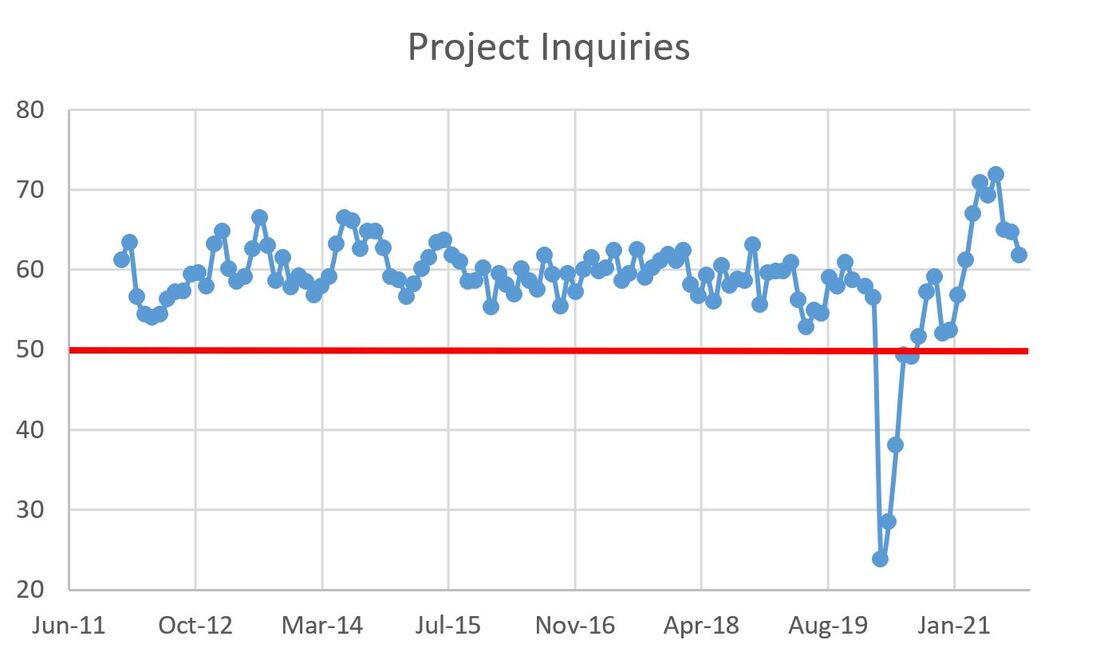
monLet's pivot to contractor backlogs, which are reported by Associated Builders and Contractors (ABC) as the Construction Backlog Indicator (CBI). Speaking very generally, when backlogs increase, it is a indicator that contractors are getting busy and, hence, the construction industry is healthier. As the spoiler alert title of this post indicates, the overall CBI has declined the past two month, coming in at 7.6 months for September, declining from 7.7 months in August and 8.5 months in July. Sounds a bit ominous, but keep in mind that the ABI also declined from May to June and June to July before rebounding. CBI may be going through the same gyrations. The figure below shows quarterly CBI data, which mutes the affects of monthly increases and declines, yet the recent downward trend is evident.
Picture
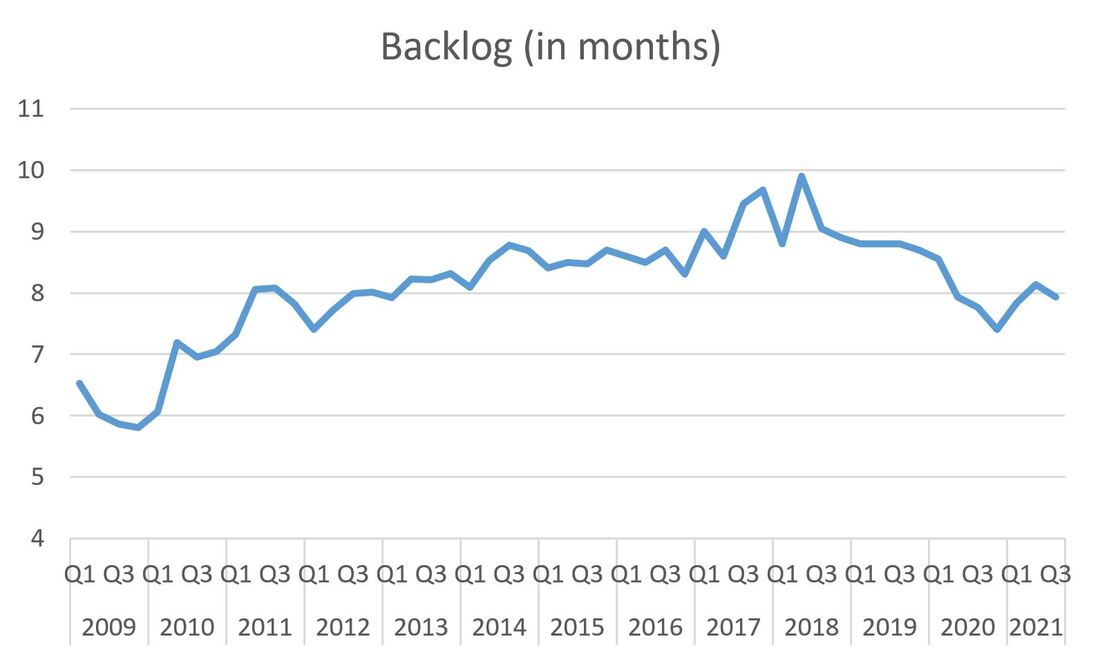
Just because the overall CBI is down doesn't mean there are not some rays of sunshine in the data. The industry sector breakdown for September :
  • Commercial & Institutional: 7.8 months (no change from August)
  • Heavy Industry: 7.5 months (up sharply from 5.4 last month)
  • Infrastructure: 7.4 months (down from 7.7 months in August)
In June I made a pithy comment that, in spite of Congress spending a lot of time debating infrastructure, the infrastructure backlog was relatively weak. Since then, the Infrastructure CBI climbed to 10.2 months in June 2021 and increased again in July to 11.3, before backsliding in August and September. Perhaps we will finally get a bill passed that leads to more infrastructure investment (a fairly non-partisan issue) which will increase contractor backlogs. The overall quarterly numbers are represented below through Q3 2021:
Picture
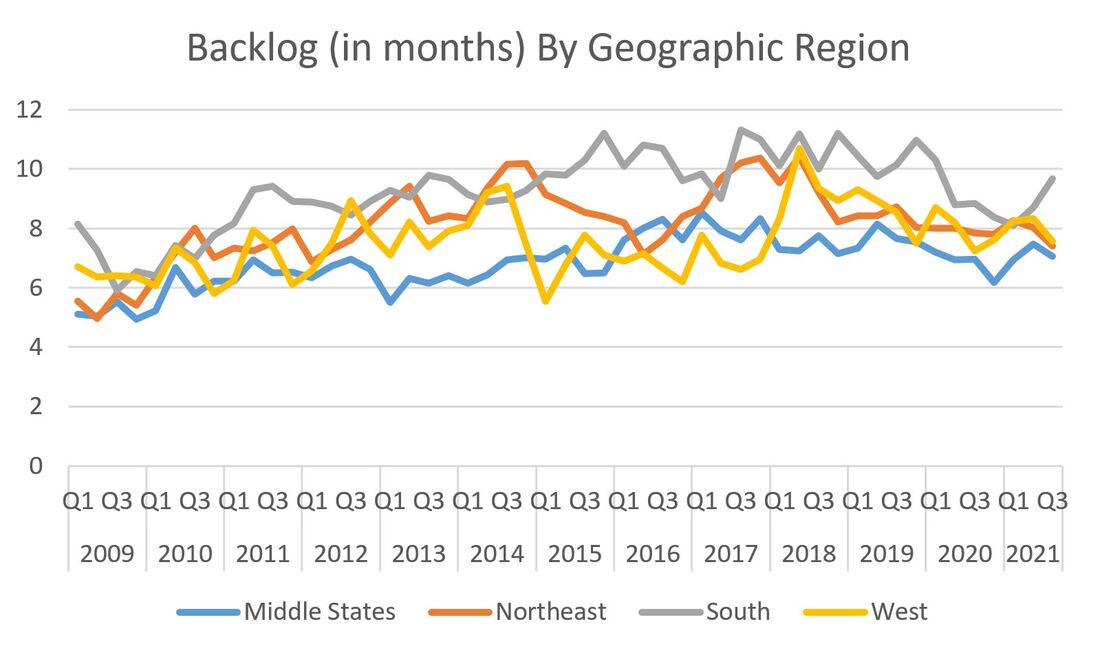
Moving on to geographic area, the results are more mixed:
  • Middle States: 6.7 months (down from 7.4 months in August)
  • Northeast: 6.6 months (down from 7.4 months in August)
  • South: 10.3 months (up from 8.9 months last month)
  • West: 6.3 months (down from 7.4 months the previous month)
The CBI figures mirror ABI data with the exception of middle America which saw an increase in ABI and a decrease in CBI. ​The quarterly trends through the Q3 are shown in the figure below:
Picture
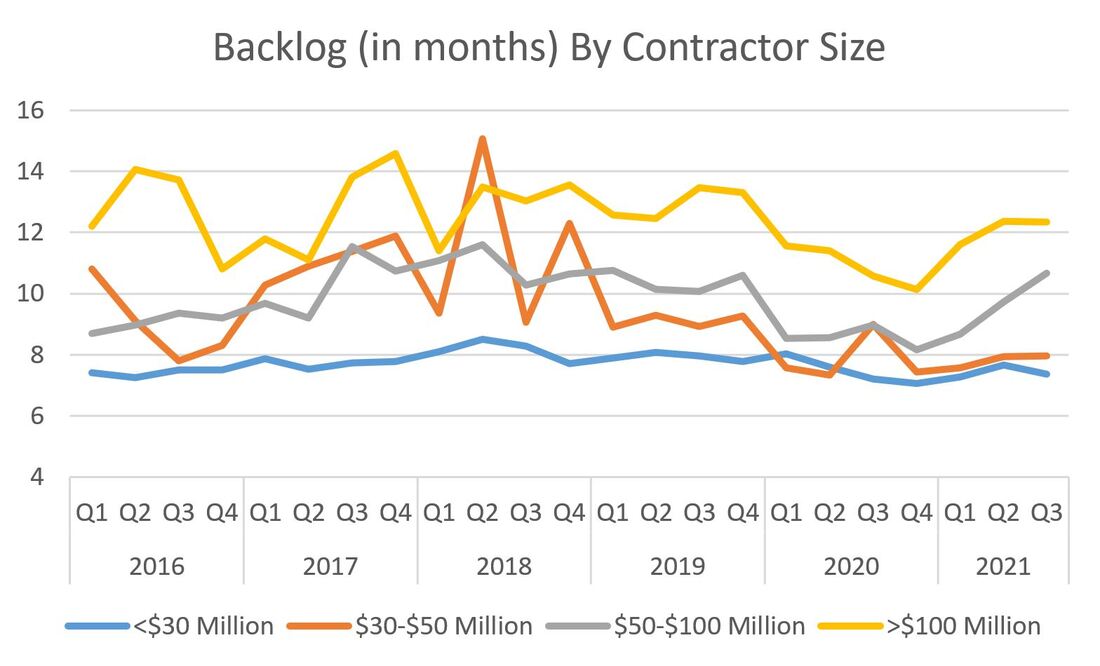
The last CBI breakdown data is by contractor size, which as three increases to one decrease:
  • <$30 million: 6.8 months (down from 7.4 months in August)
  • $30-$50 million: 7.8 months (a modest increase from 7.5 last month)
  • $50-$100 million: 11.1 months (up from last month's 10.9; apparently this is a sweet spot)
  • >$100 million: 10.6 months (a modest increase from August's 10.4)
Picture
The data presents a mixed bag with ABI up and CBI down and that permeates into the specific indices. This is likely to continue while the overall economy stays strong but commodity prices staying high and labor supplies remaining low. For every tailwind comes a headwind. 2021 continues to be interesting.
0 Comments

    Archives

    November 2022
    October 2022
    September 2022
    July 2022
    June 2022
    May 2022
    April 2022
    March 2022
    February 2022
    December 2021
    November 2021
    October 2021
    September 2021
    August 2021
    July 2021
    June 2021
    May 2021
    April 2021
    March 2021
    January 2021
    December 2020
    November 2020
    October 2020
    September 2020
    August 2020
    July 2020
    June 2020
    May 2020
    April 2020
    September 2019
    August 2019
    September 2018
    June 2018
    April 2018
    March 2018
    February 2018
    January 2018
    March 2016
    February 2016
    January 2016
    November 2015
    February 2015
    December 2014
    November 2014
    September 2014
    August 2014
    July 2014
    June 2014
    May 2014
    April 2014
    March 2014
    February 2014
    January 2014
    December 2013
    November 2013
    October 2013
    July 2013
    April 2013
    March 2013
    February 2013
    January 2013
    December 2012
    November 2012
    July 2012
    May 2012
    April 2012
    February 2012

    Categories

    All
    Economics
    Real Estate
    Technology

    RSS Feed

Powered by Create your own unique website with customizable templates.
  • About
  • Builder Blog
  • Tacos & Tower Cranes
  • In the News
  • For CM Students