|
Today in Sacramento, it's supposed to get to 106 degrees and the air is unhealthily thick with smoke and ash from wildfires and I say to myself, "well, it cannot get any worse." It's 2020. Of course it can. First came the news that infrastructure project starts fell 31% in July. While the article goes on to say the news isn't all bad, it's hard to casually move past the nosedive, even for a month, of a major component of the overall construction market. Particularly when it is the same infrastructure that almost everyone, even political cats and dogs who concur on almost nothing, agree we should be providing more money towards. Combine this drop with the decrease in contractor backlogs and confidence in July and it is hard to see the silver lining. Because it is that time of the month, I decided to check on the American Institute of Architect's Architectural Billings Index (ABI) to see what our favorite construction leading economic indicator is up to. Sure enough, the July figures were released this morning. Before the big reveal, it is important to note that the ABI is a leading indicator of commercial building construction by approximately nine to 12 months. A value greater than 50 means that architecture billings are increasing; any value less than 50, as is the case for the past few months, means billings are decreasing. For July, the song remains the same, with a repeat of June's 40 figure. But hey, it's not falling! 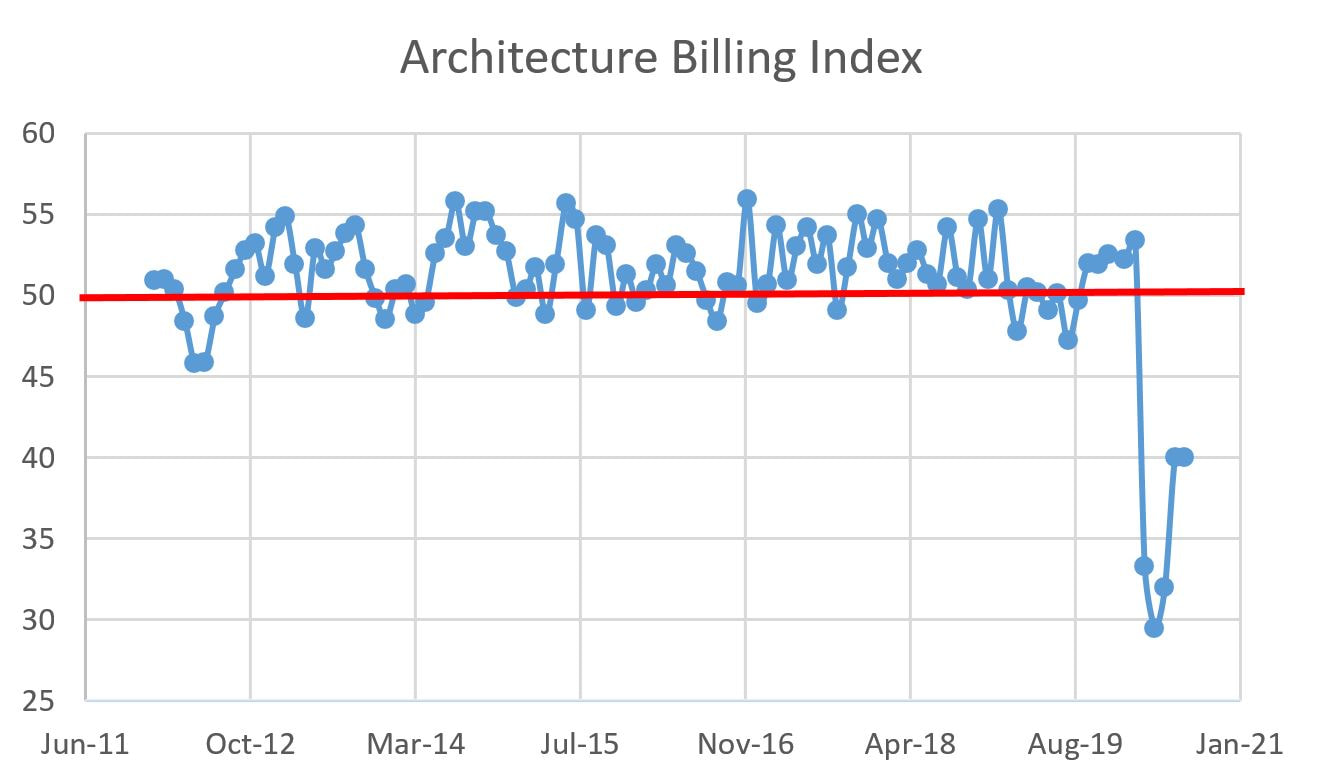 Next month's results will be very interesting. In June I was concerned with a dead cat bounce. A downward trend in the August ABI may hint to that, while, conversely, an increase may indicate we are climbing out of the hole, albeit with fits and starts. My curiosity, having kicked into high gear, led me to dig into some AIA data I have never shared in this blog. The first figure shows data for project inquiries. 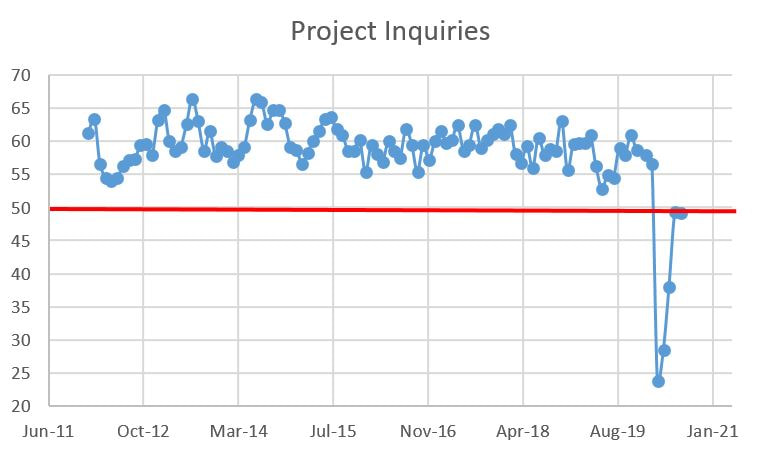 Inquiries are almost to 50, yet inquiries are just that: people kicking the tires on potential projects. Don't get me wrong, the trend is certainly positive but it doesn't measure any commitment on the part of owners to start projects any more than test driving a car indicates a commitment to buy. The better figure for gauging that is for design contracts. As luck would have it, AIA tracks that as well. 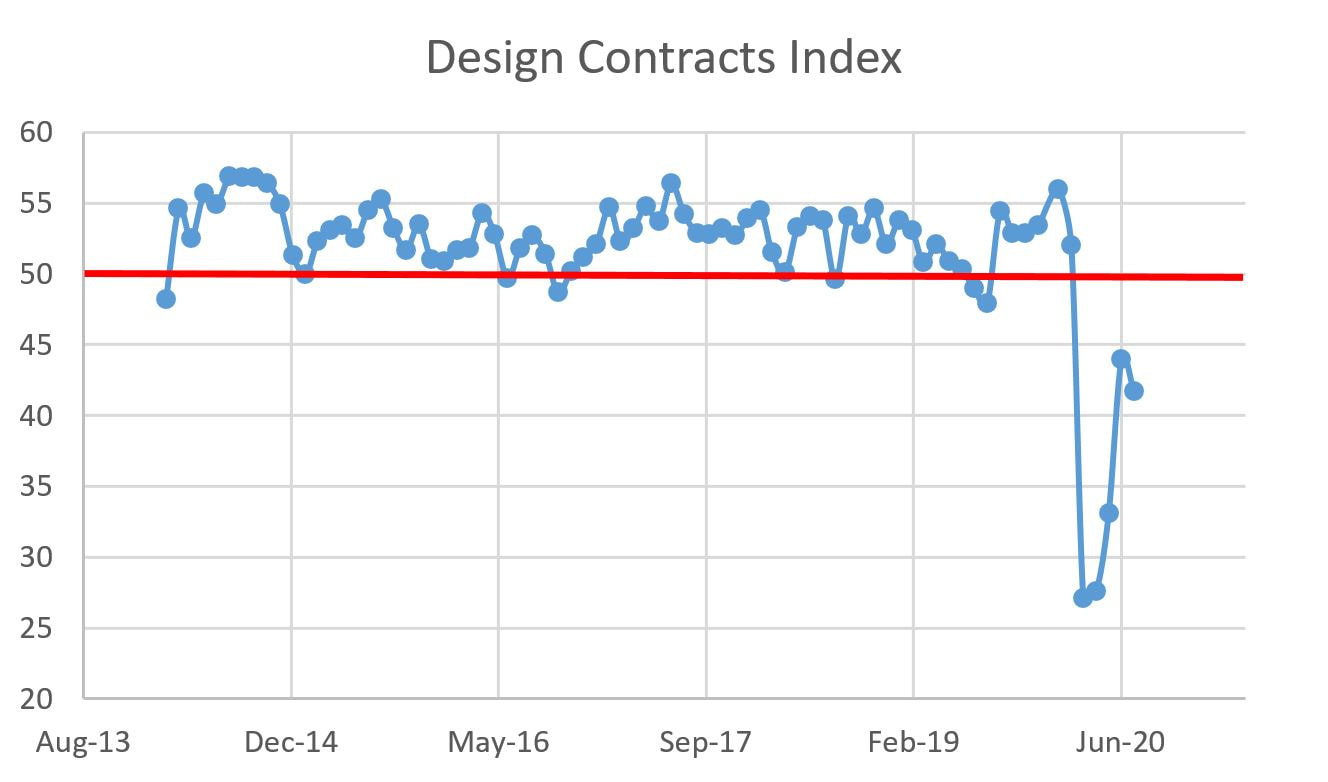 That's where the luck ends. The rate of new contracts actually declined, from 44 in June to 41.7 in July. Design contracts are a leading indicator of billings (leading indicator on leading indicator), so there's an argument to be made by the pessimists that we are in for rockier times. We shall see. For the regionals:
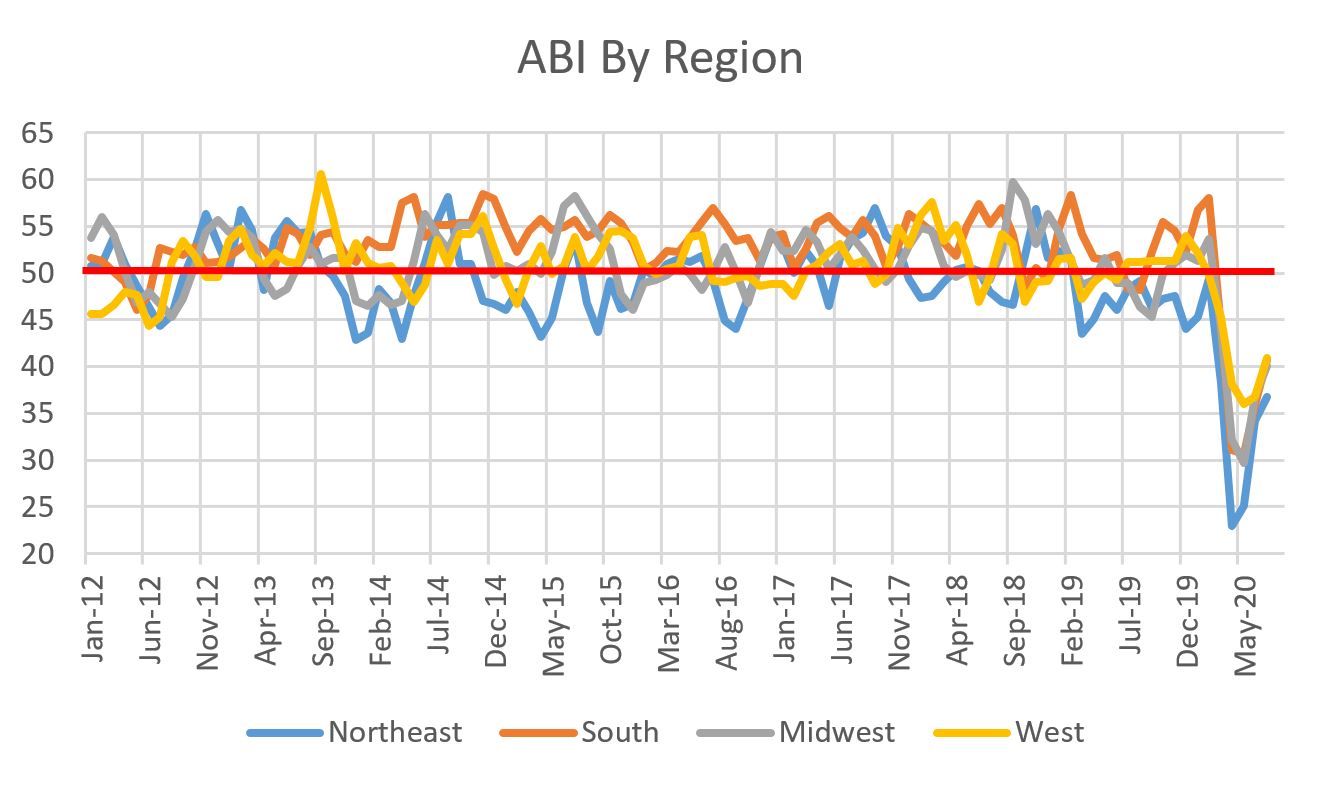 The Sector Averages for July 2020 are as follows:
Some economic indicators are up, others down (sharply in some cases) and a whole lot of let's-see-what-happens-next-month. In other words, your daily reminder it's 2020.
0 Comments
Leave a Reply. |
Archives
January 2024
Categories |
 RSS Feed