|
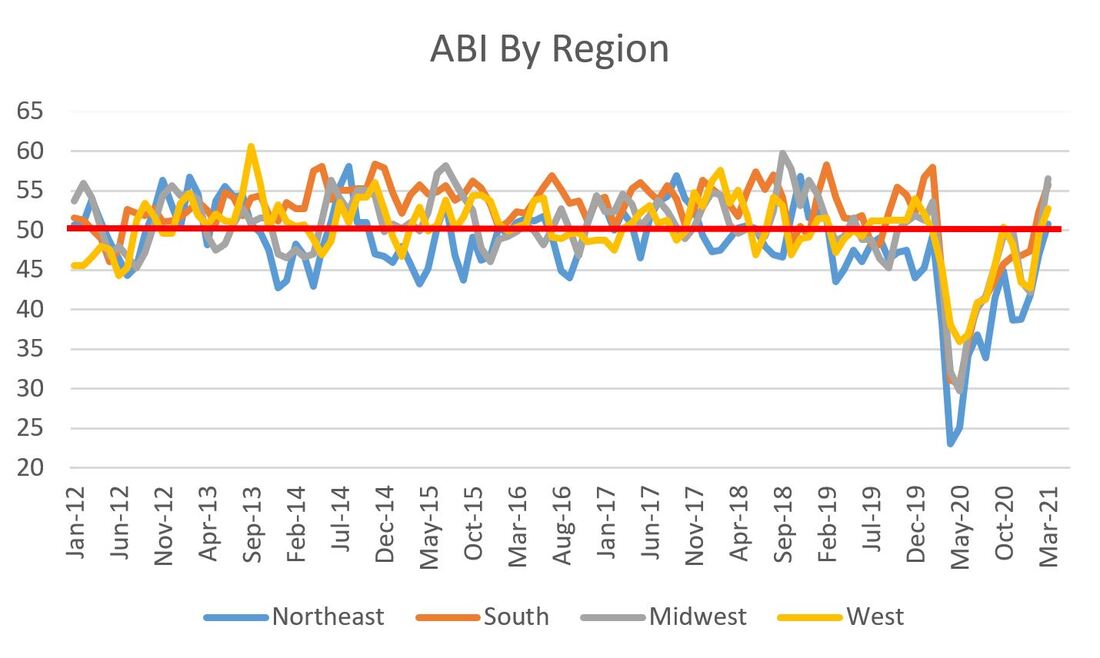
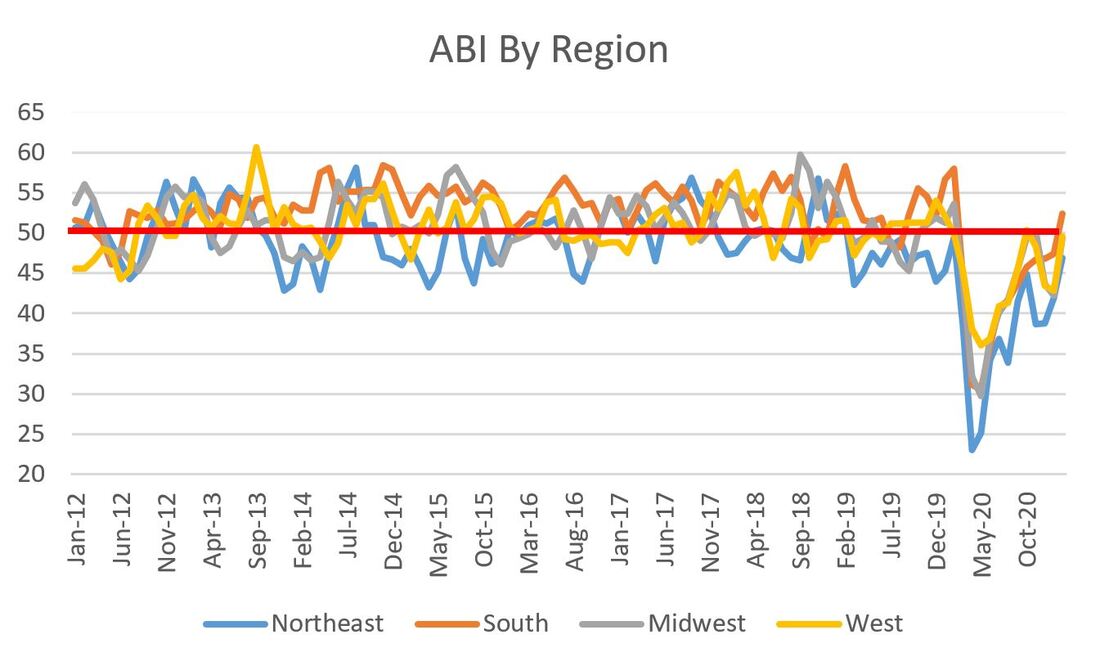
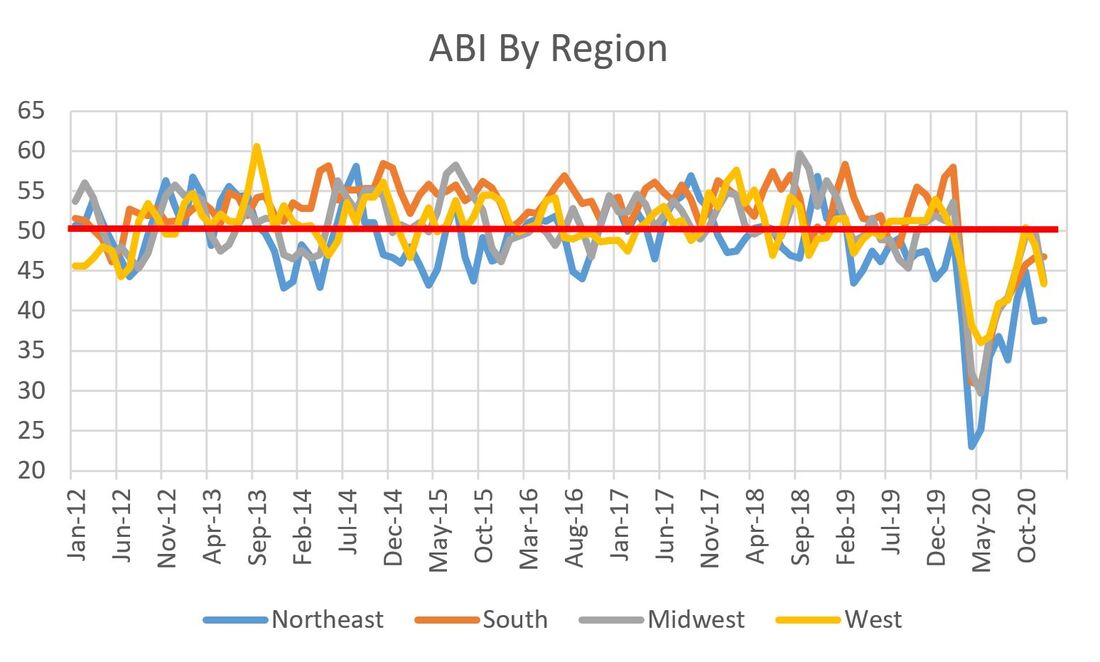
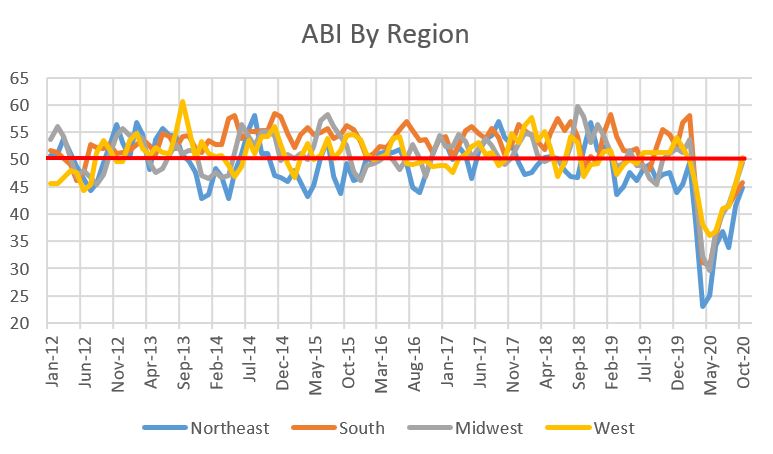
With spring flowers came a torrent of demand for architectural services. The American Institute of Architects' Architecture Billings Index (ABI) increased for the fourth straight month and has been above 50 for two straight months, clocking in at a robust 55.6 for March 2021. Why is a value greater than 50 important? A value greater than 50 means that architecture billings are increasing; conversely, any value less than 50 means billings are decreasing. Architectural billings are a great nine to 12 month leading indicator of construction activity. 55.6 is the highest ABI since December 2017. Fantastic! 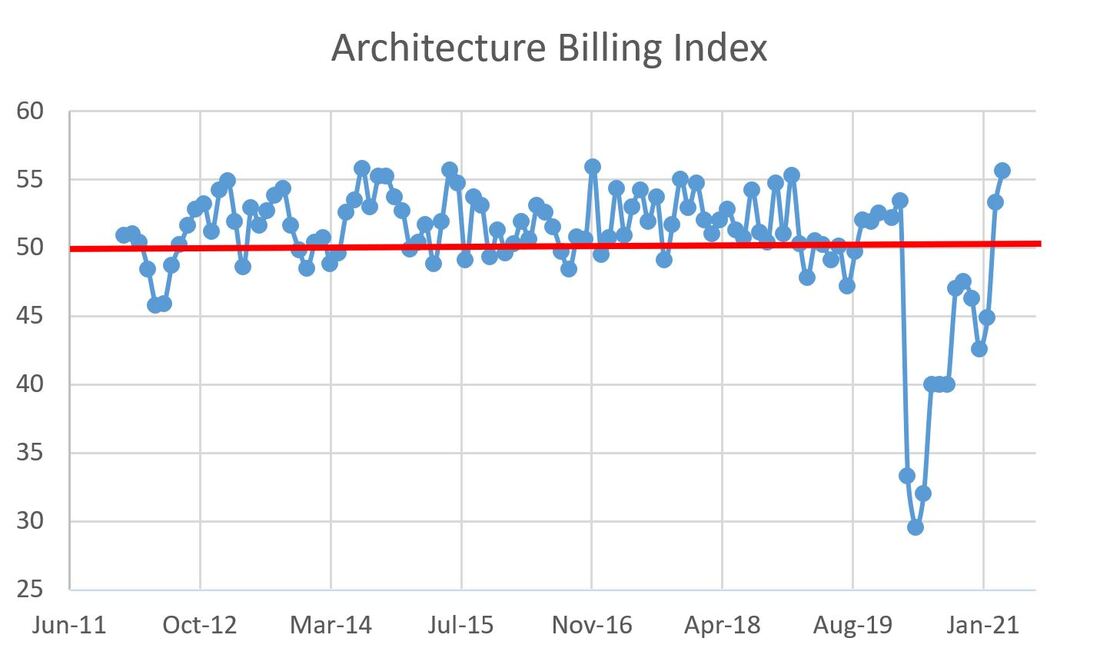 As if March's overall ABI figure wasn't good enough news, all of the ABI subcategories were also above 50. It has been a very long time (February 2019 I believe). The regional data is as follows:
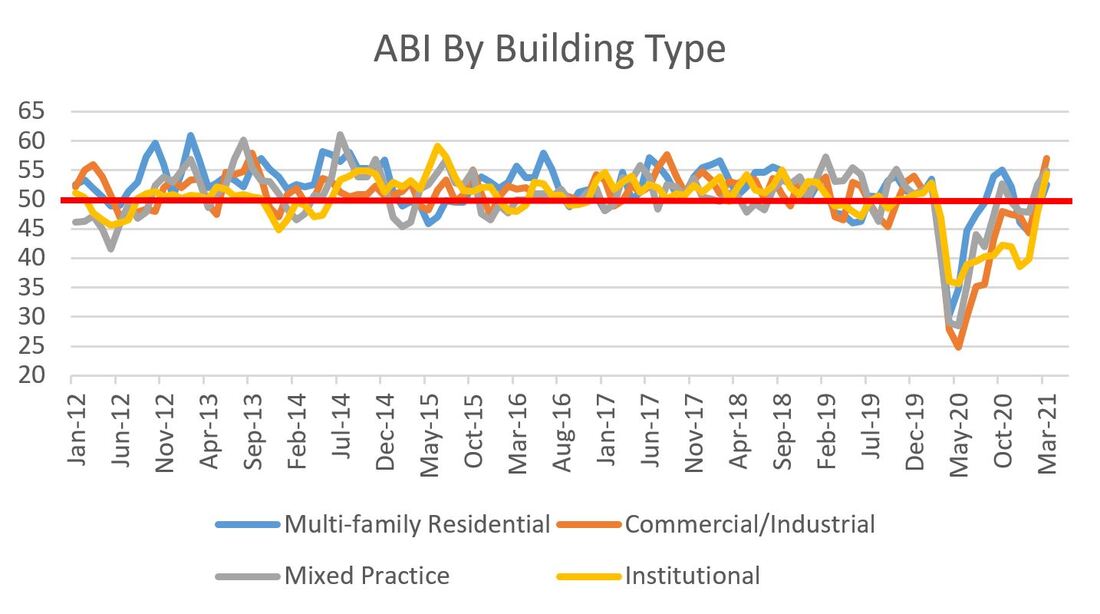
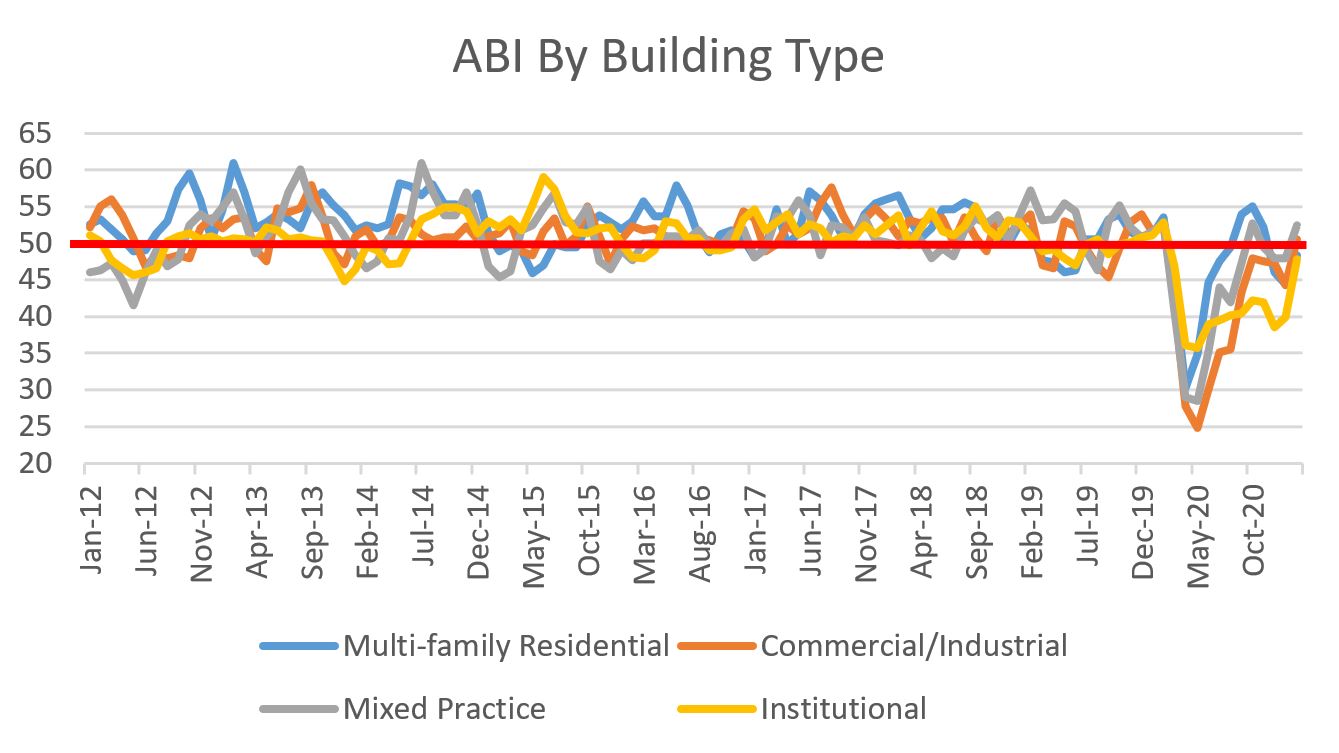
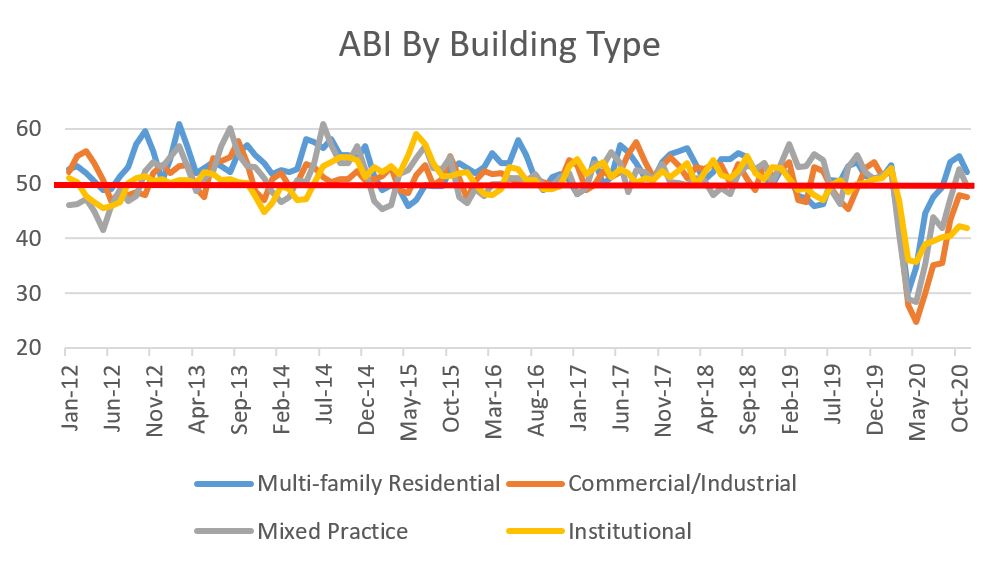
 The industry sector breakdown:
 Does this recovery have steam? The project inquiries, coming in at 66.9, seem to indicate so. This is the highest that metric has been since I started following ABI in 2012. 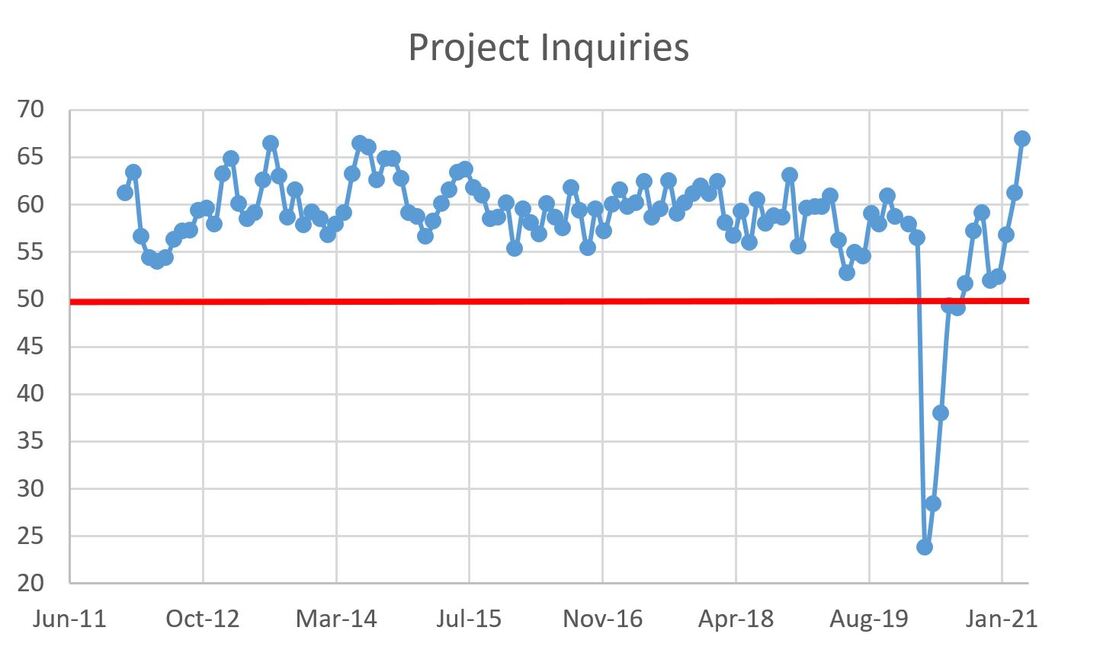 There is not much color commentary needed. March was a great month and shows that there is a lot life in the AEC industry.
0 Comments
Back in black I hit the sack I've been too long, I'm glad to be back Yes, I'm let loose From the noose That's kept me hanging about I've been looking at the sky 'Cause it's gettin' me high Forget the hearse 'cause I never die I got nine lives Cat's eyes Abusin' every one of them and running wild -AC/DC "Back in Black" Thanks for tolerating my trip back to high school head banging. Speaking of peaking, the American Institute of Architects' Architecture Billings Index (ABI) is back to where it was in February 2020 and has surged into positive territory, clocking a 53.3 for February 2021. A value greater than 50 means that architecture billings are increasing; conversely, any value less than 50 means billings are decreasing. The ABI is a leading indicator of commercial building construction by approximately nine to 12 months. Whew...we needed this little ray of sunshine. 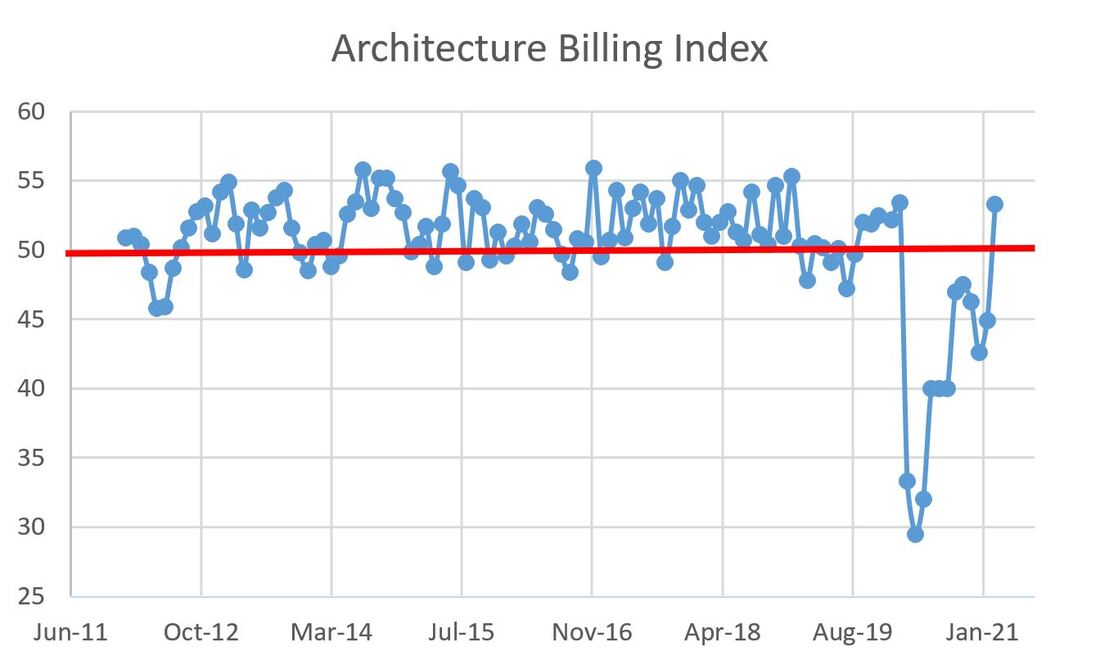 To be clear, we are not totally our of the woods as there are still areas of weakness (sub 50 results), as evidenced by the regional data:
 For the industry sector breakdown, the balance between advancers and decliners was split 50/50:
 Project inquiries have been above 50 since August, but they pierced the 60 level in February. 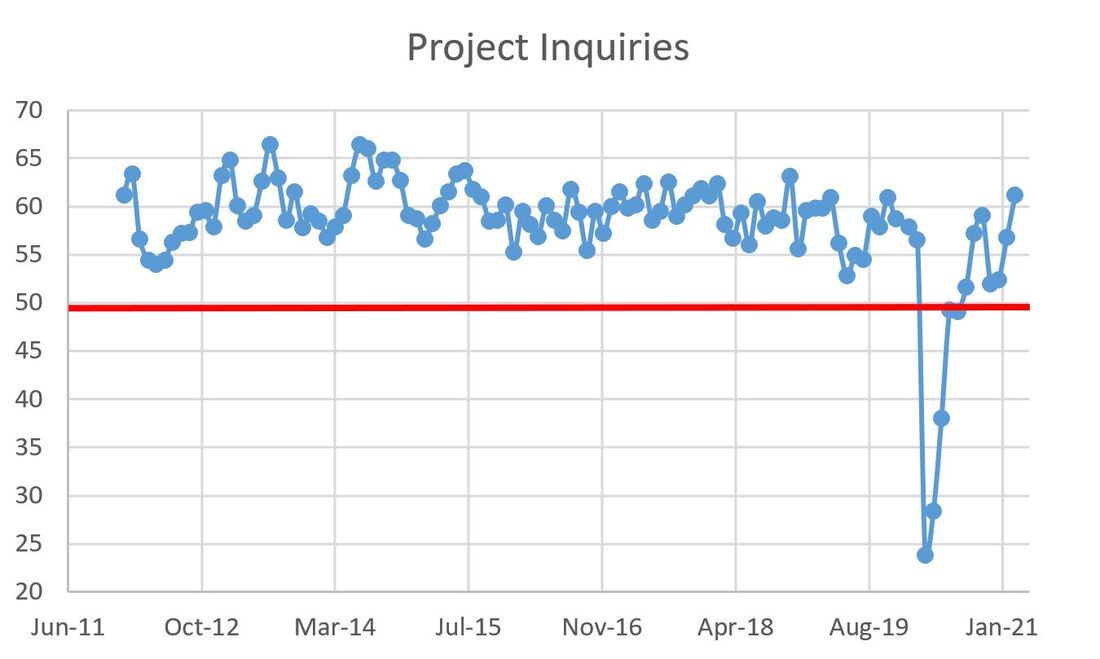 All in all, pretty good news from the billings front, likely supported by larger positive macro trends (vaccination roll out, stimulus, Federal Reserve holding steady, and on and on...). It is nice to finally have some good news. That said, the construction industry still has some headwinds to watch (commodity prices and labor constraints to name but two). Let's worry about that next week. For now, let's just enjoy this month's ABI.
That title is a Jedi mind trick...yes, the American Institute of Architects' Architecture Billings Index (ABI) did slow its declines from last month, but they are still declining. The January 2021 ABI figure came in last week at 44.9, up from 42.3 in December. Bigger is better, however values less than 50 mean that billings are decreasing. The last time the ABA was above 50, meaning they were increasing, was February of last year (you know, before COVID put the United States into a state of chaos). Next month ought to be interesting. The ABI serves as an approximately nine to 12-month leading indicator for commercial building construction activity. 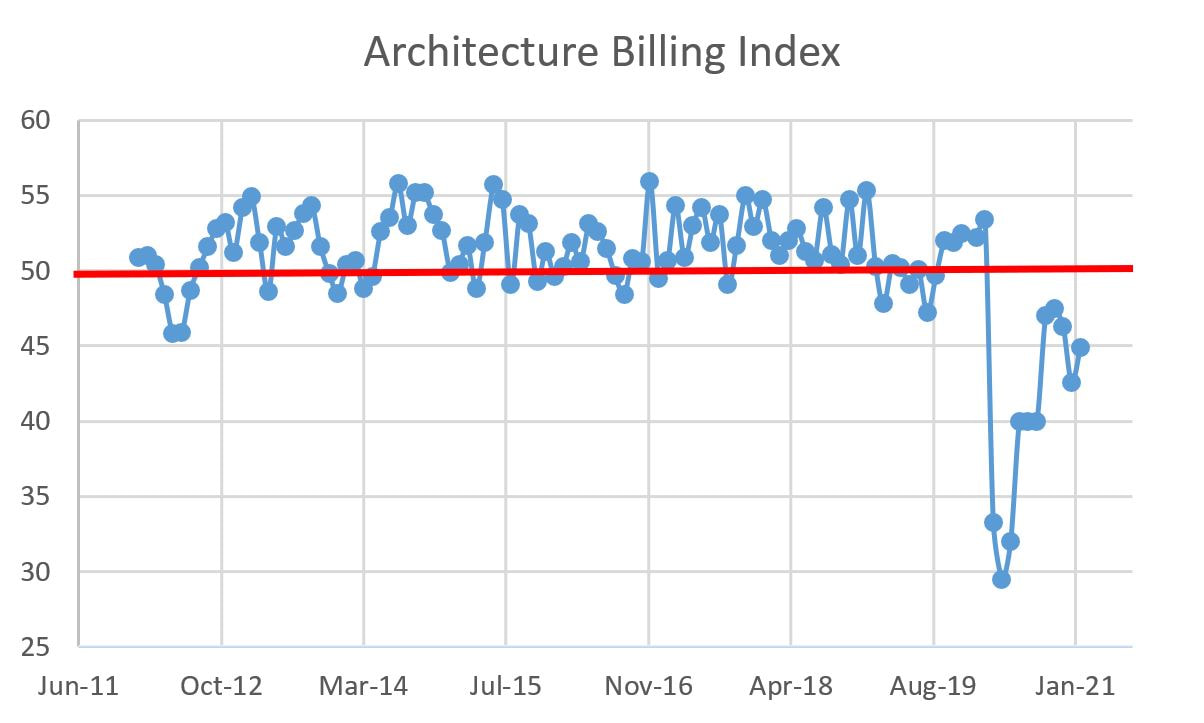 The ABI is way off its lows of April 2020, where it logged a dismal 29.5, yet there was another more modest decline in the last two months of 2020. This recent figure shows a positive reversal in that trend. That same post-cratering dip shows up in the project inquiries graph, but it too reversed in January 2021. 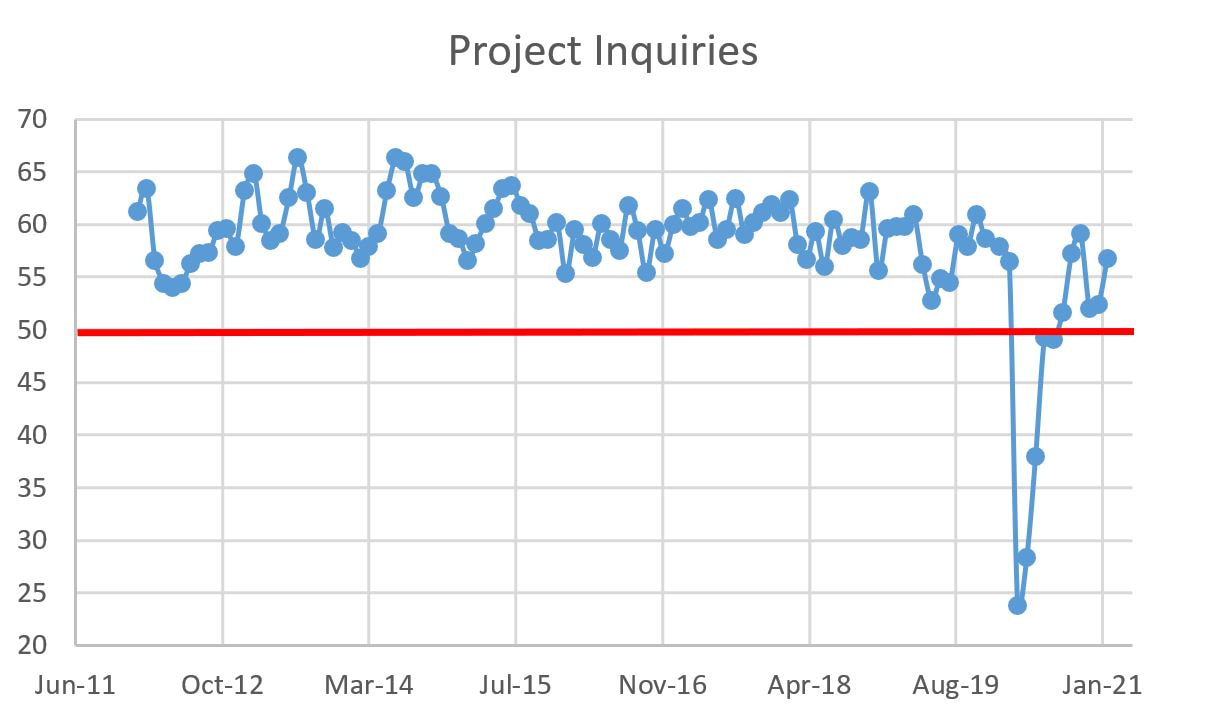 The specific data is a collection of mixed bag results with some up from last month and others down. For the regional data, there are two advancers and two decliners. Unfortunately, I live in one of the decliners.
 For the industry sector breakdown, the decliners outnumbered the advancers 3 to 1:
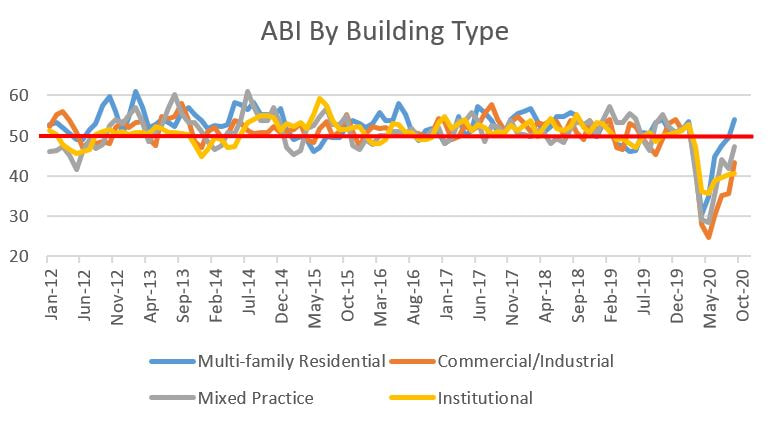
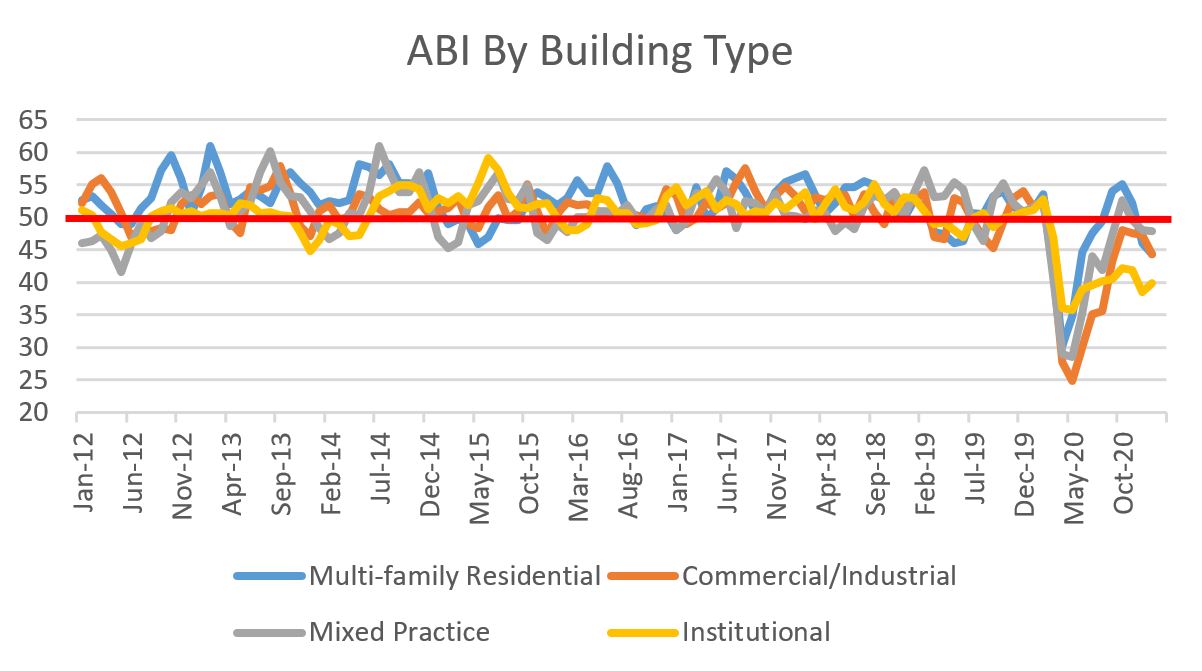 While institutional projects did not plumb the same depths as the three other sectors, it is clearly the laggard as the market corrects. The fits-and-starts of the ABI (and its subcategories) also loosely follows the Chicago Board of Options Exchange volatility index for stocks (VIX) which may suggest that billings are trending with greater economic sentiment (a theory I am wholly unable to prove/disprove but does make me wonder). Where as stock traders like volatility and the corresponding price changes, I am guessing most of us in the AEC world would prefer some stability. Hopefully the wild fluctuations are subsiding. Tune in next month for the one-year anniversary of the ABI's 38% drop to see how we have recovered since then.
If I could impose a New Year’s resolution on the design and construction industry, it would be for more work in 2021. Imagine my disappointment upon opening the American Institute of Architects (AIA) press release showing a decline in Architecture Billings Index (ABI). Then it dawned on me…this decline occurred in December. For the time being, the resolution is intact. Whether we should hold our collective breaths is debatable, but I hope we have purged the declines and are leaving them in 2020. The ABI for December was 42.6, a sizable decline from November’s 46.3. The AIA publishes the ABI as am approximately nine to 12-month leading indicator for commercial building construction activity. A value greater than 50 means that architecture billings are increasing; any value less than 50 means billings are decreasing.  Two very minor bright spots and two big losses in the regional indices:
 There’s one bad actor among the building types and it’s a bit unexpected:
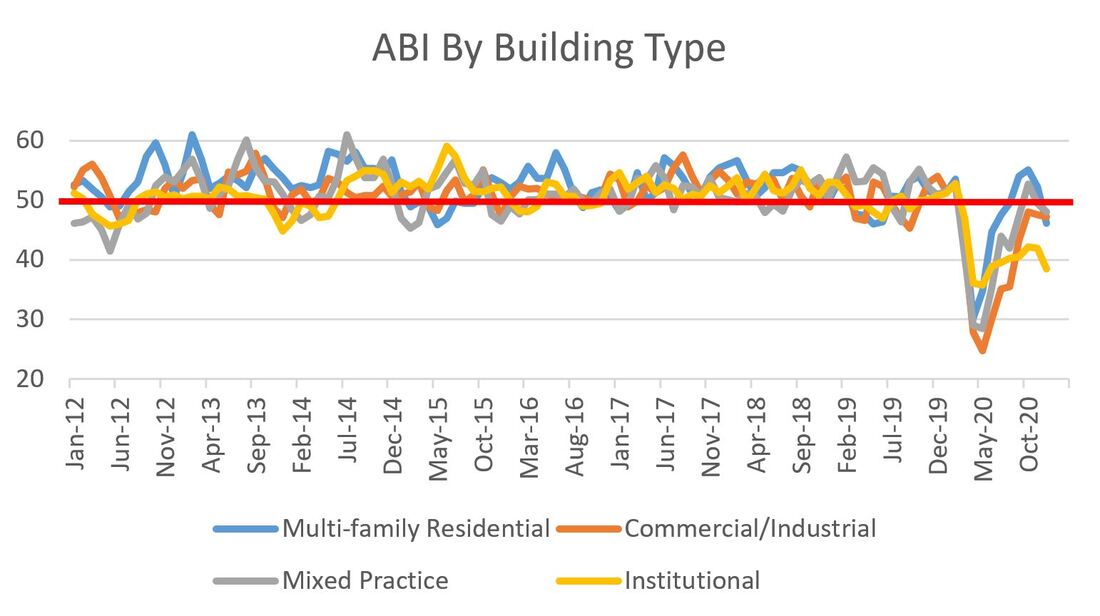 The multi-family decline is particularly noteworthy. That sector has been the strongest for several years and responded rather well after cratering to an ABI of 30.3 in April as the COVID-19 pandemic was gripping the world. As is true for all data, one point does not signify a trend so no need to panic yet, but I’m very curious about next month’s number. One last point: I bring up project inquiries every so often in these posts and December’s figure of 52.4 is curious. Not only is it above 50, but it increased (albeit slightly) from 52 in November. Before everyone gets too excited, the inquiries are just that: people inquiring about projects. Not much more than kicking the tires on an idea for a project. Additionally, the average inquiry index going back to January 2012 is 58.3, so 52.4 for December is comparatively shabby. All that said, the number of inquires is growing (signified by an index of greater than 50), so the interest in projects is there. I may be trying to generate optimism where it doesn’t exist, but I do see that as the silver lining in an otherwise dismal month. And technically, the ABI New Year’s resolution is still intact…fingers crossed for January. 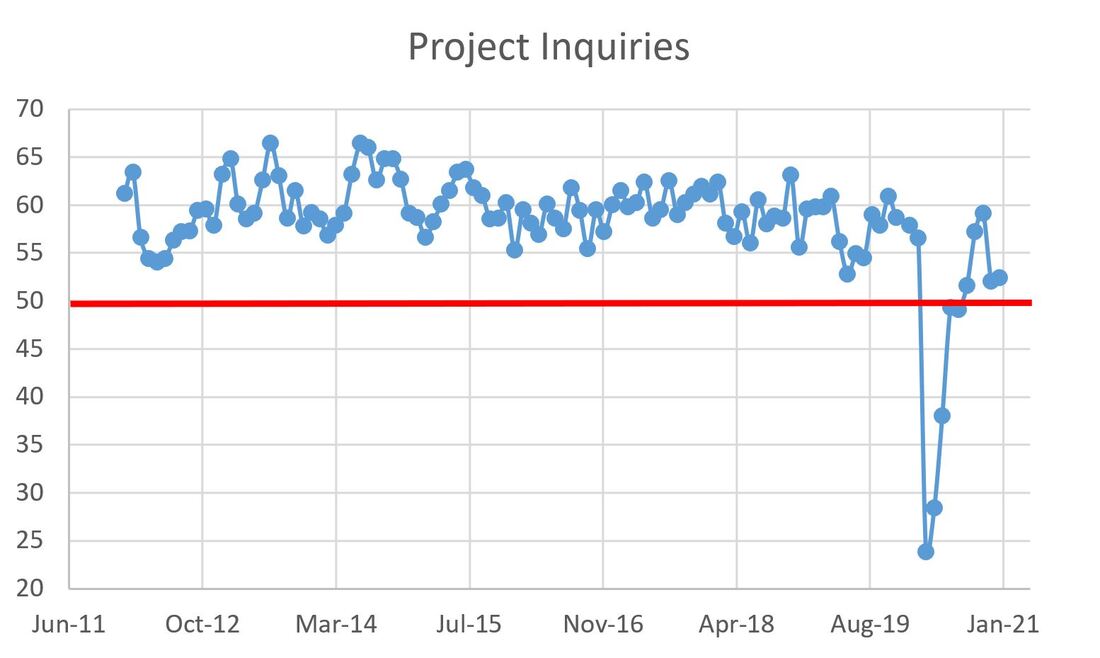 The good news is that there's only nine days left in 2020. That's it, that's all I have. But, if you are curious about architectural billings, proceed with caution. The American Institute of Architects (AIA) publishes the Architecture Billings Index (ABI), which serves as a leading indicator of commercial building construction by approximately nine to 12 months. A value greater than 50 means that architecture billings are increasing; any value less than 50 means billings are decreasing. Spoiler alert: there is more declining than increasing. If it is not clear I am completely over 2020. The overall ABI for November was 46.3, a decline from 47.5 in October. This is the first decline since April.  All is not lost as there are some minor bright spots in the regional data if you squint:
 And then we get to the industry sector breakdown...keep on squinting:
 So there are a few bright spots as we glide through the holiday season, but overall we ended the calendar year weakly. Wake me up when it's 2021.
Let's get the bad news out of the way: the American Institute of Architect's Architectural Billings Index (ABI) clocked in at 47.5 for October. That is an increase over the previous month's reading of 47, yet a value less than 50 signifies that billings are decreasing (conversely, and this will be important if you continue reading, values greater than 50 mean billings are increasing). The ABI is a leading indicator of commercial building construction by approximately nine to 12 months, so it is an important leading economic indicator for the commercial building construction industry. Project inquiries increase their streak of being above 50 to three months with October registering a measuring in at 59.1. Inquiries represent interest in projects but not the actual start of design. 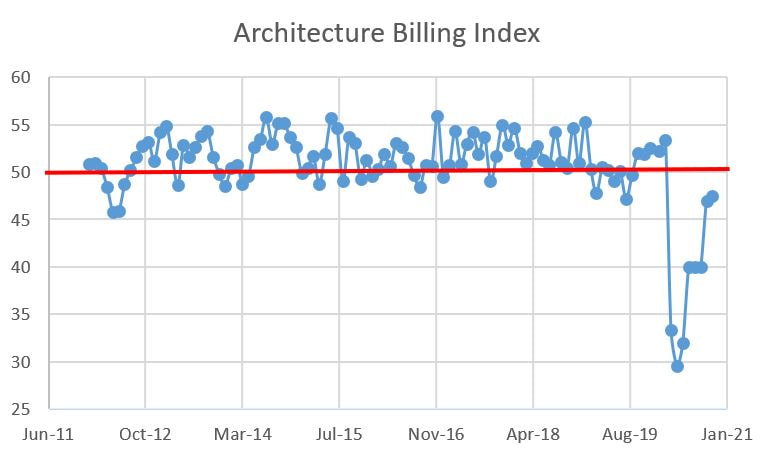 Now let's pivot towards some good(-ish) news: In terms of ABI measures with respect to geographic regions, all regions increased from the previous month and the West pierced the 50 level, being the first region to do so since February:
 Now that I have your attention with some moderately good news, here's some even more moderately good news: all four industry sectors saw increases and TWO broke 50:
 Given COVID, these gains are heartening and the industry is certainly moving in the right direction. That said, as I type this, we're staring at a giant third wave of COVID infections, the never ending post-election hangover and Congress heading for vacation without seriously considering a relief package. Hopefully this compendium of issues does not derail the planning and design of commercial buildings.
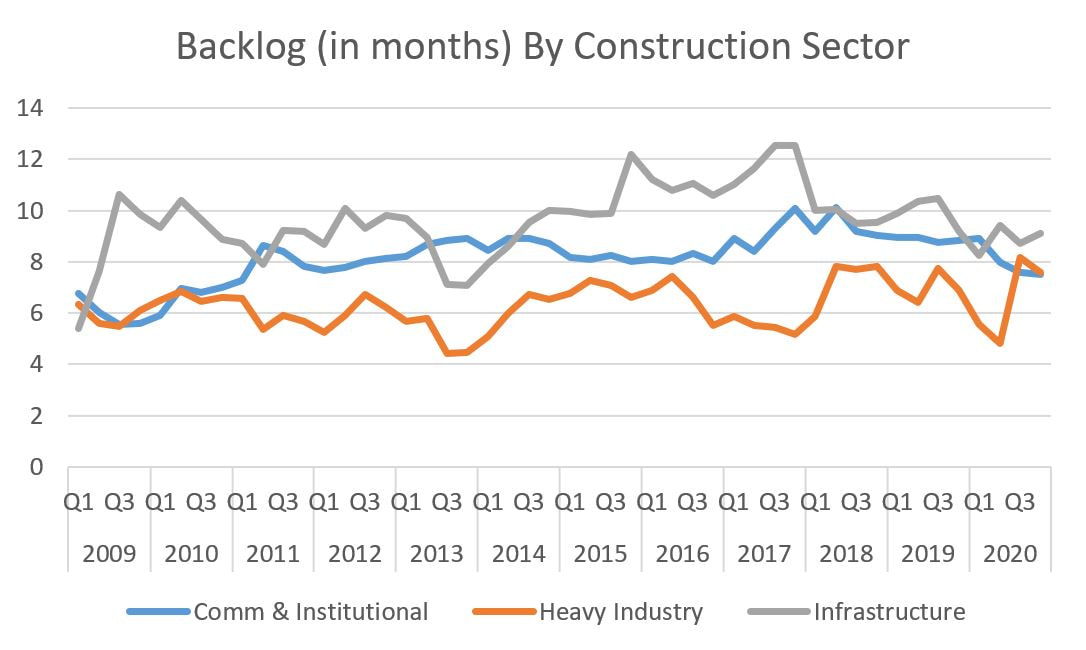
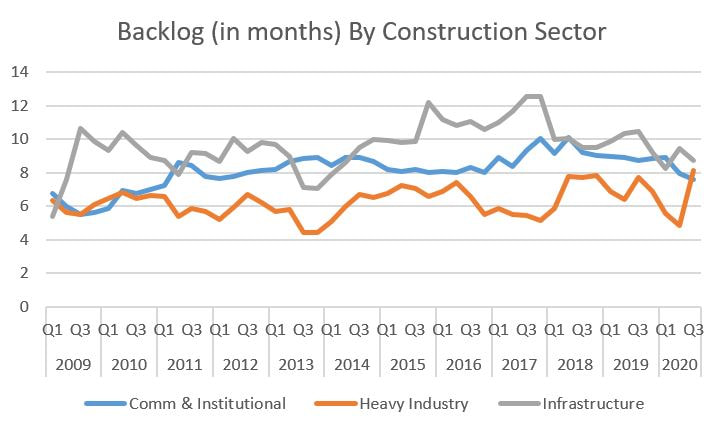
While COVID-19 is still dominating the headlines around the world, the construction industry still shows pent-up demand in the United States. This morning, the Associated Builders and Contractors (ABC) reported that its Construction Backlog Indicator for October increased 0.2 months from the previous month. While October 2020’s overall backlog of 7.7 months is 1.2 months lower than the October 2019 measure, it remains remarkably stable given the economic uncertainty surrounding the nation. The graphs below display quarterly data. October is the first month for the last quarter of the year, so Q4 is incomplete. 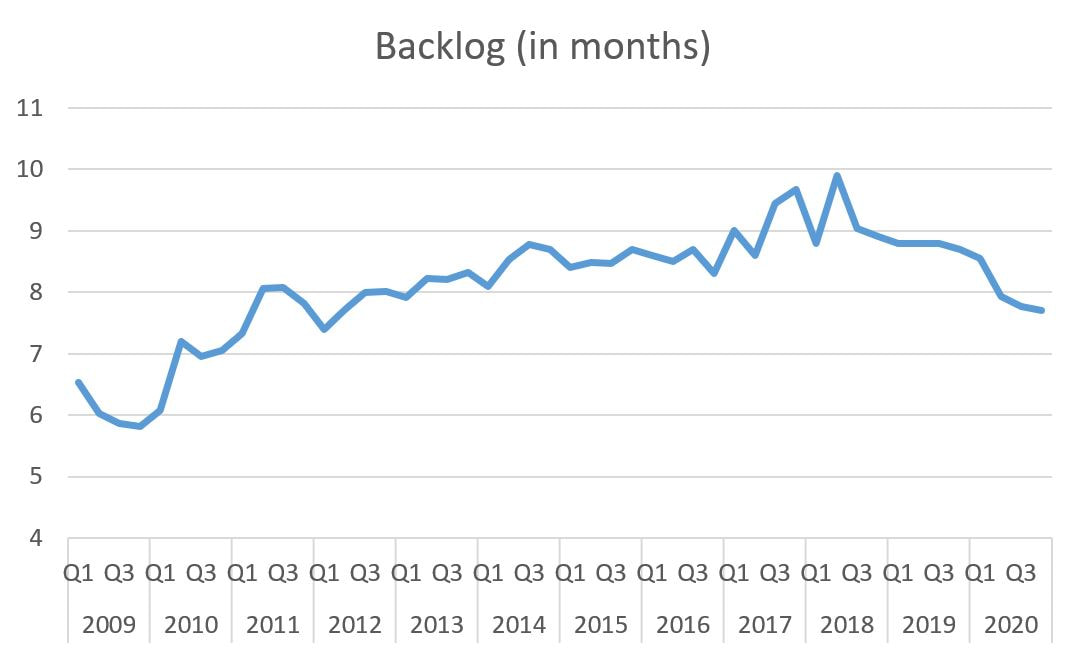 Let’s dig into the detailed backlogs, starting with the industry sector breakdown for October:
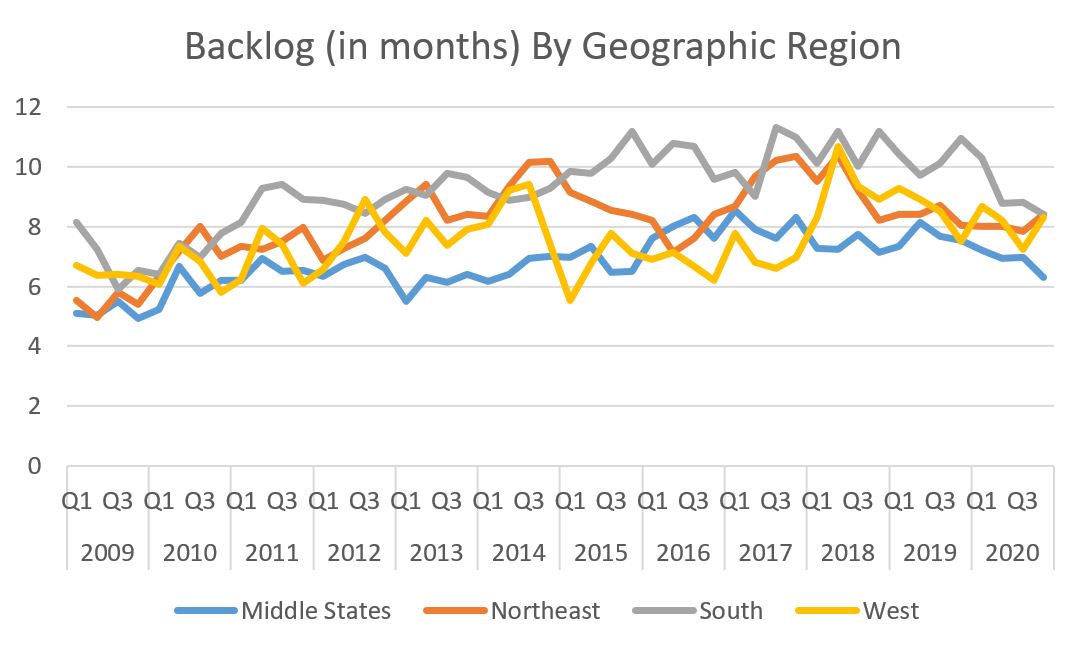
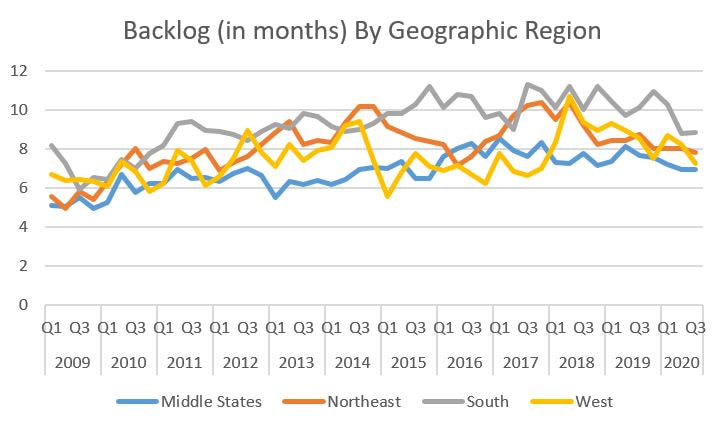
 Turning to geographic area, there seems to be a bit of give-and-take with two regions up and one down sharply and one holding fairly steady:
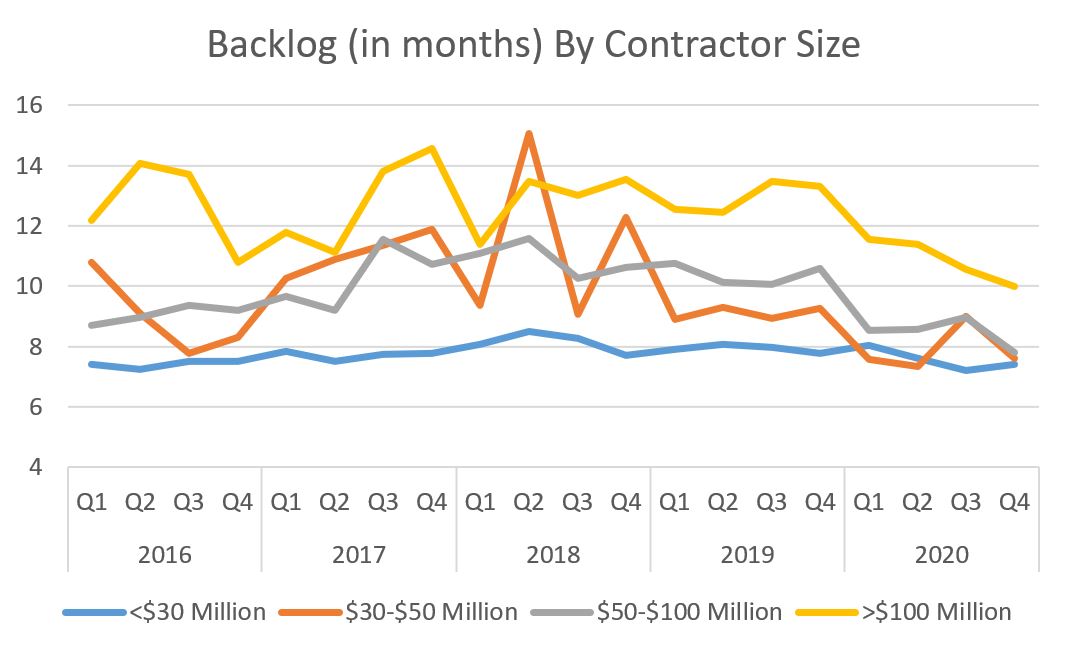
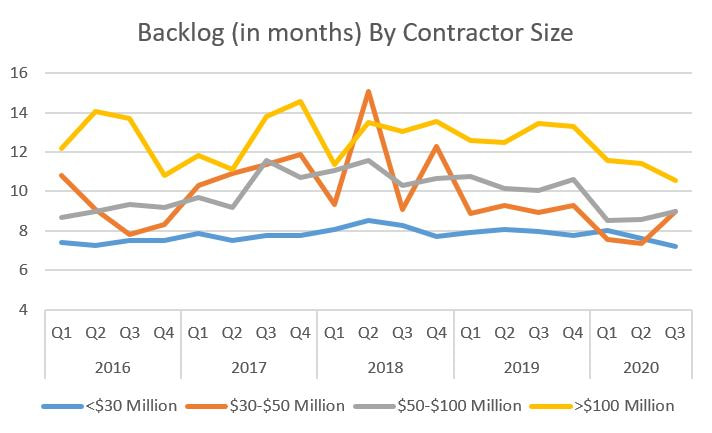
 Last are backlog data by contractor size:
 Also in the news today is Dodge Data & Analytics reporting that its 2021 Construction Outlook is pointing to $771 billion in construction starts, a 4% increase from last year. Dodge is expecting a drop in multi-family construction of 1%. This is more likely a sign of that superheated segment coming to the end of its cycle than the negative affects of COVID-19. The other sectors expected to see declines are predictable: retail and hotels. Institutional and public sector construction are predicted to be basically flat or see modest gains, which is also expected given that government aid is uncertain, a trend likely to continue with COVID-19 and the possibility of future gridlock between the Executive Branch and Congress. Manufacturing is also expected to be flat. Private construction is expected to increase with the usual suspects leading the way. Warehouses and data centers are expected to increase 5% as the FAANG companies (Facebook, Amazon, Apple, Netflix and Google) and their smaller peers continue to dominate while utilities are expected to increase a whopping 35% due to expected starts liquid natural gas exporting facilities and wind farms.
The WELL Expansion is going vertical. The first structural steel column was set last week while the footings are being placed on the Student Health Center side of the building. The team is working furiously to get out of the ground before the weather turns wet. The whipsawing in the construction industry continues. Last month the good news/bad news was slow architectural billings but increased contractor backlogs. This month is just the opposite. So very 2020. Per usual, let's start with the American Institute of Architect's Architectural Billings Index (ABI). Per the usual refresher, the ABI is a leading indicator of commercial building construction by approximately nine to 12 months. A value greater than 50 means that architecture billings are increasing; any value less than 50 means billings are decreasing. In September the ABI increased sharply from 40 to 47 (yay!) but is still less than 50 so billings are still decreasing (boo!). The trend is definitely positive and the rebound off of April's bottom does not appear to a false narrative. Project inquiries are on a two month streak above 50 with September clocking in at 57.2. Inquiries represent interest in projects but not the actual start, but the sharp increases since April are a positive sign. Project inquiries are on a two month streak above 50 with September clocking in at 57.2. Inquiries represent interest in projects but not the actual start, but the sharp increases since April are a positive sign. 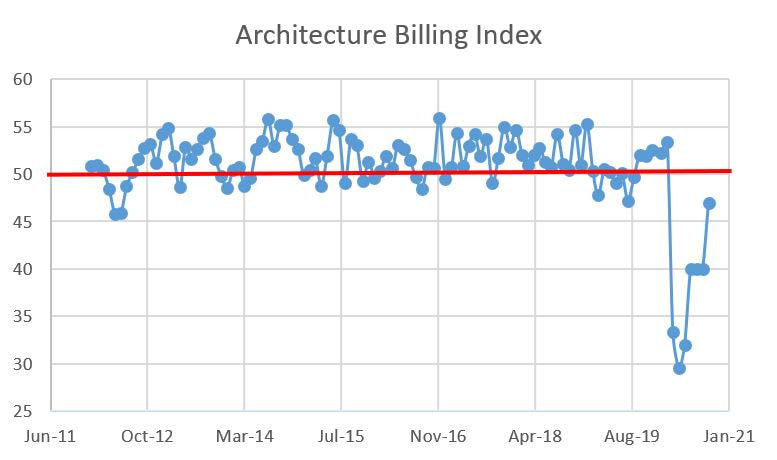 Project inquiries are on a two month streak above 50 with September clocking in at 57.2. Inquiries represent interest in projects but not the actual start, but the sharp increases since April are a positive sign. 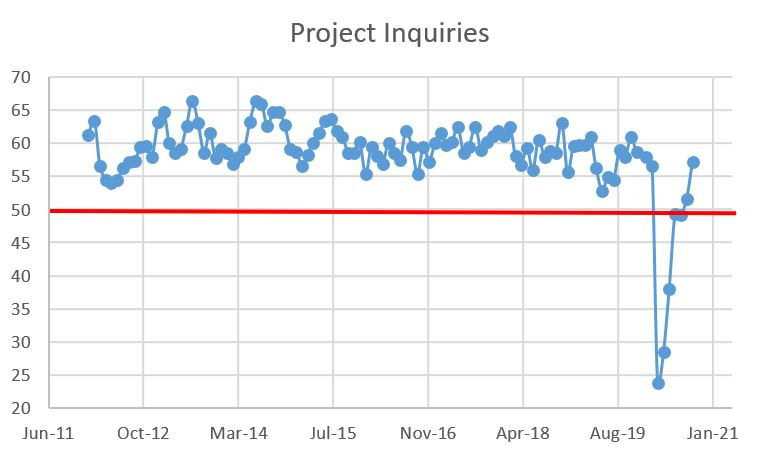 While none pierce the 50 level, the regional data shows nice increases from last month. It is a little odd to see the South in third place given its torrid growth over the past few years. The breakdown for each region is as follows:
 By building type, multi-family breached the 50 level and continues to lead all other sectors. The September stats for all are:
 Now let's look at contractor backlogs as reported by the Associated Builders and Contractors. After an increase in August, September saw decreases. The graphs below represent quarterly data through Q3 2020 so the trends continue to look negative. Contractors now have an overall backlog of 7.5 months in September, down from 8 months in August. 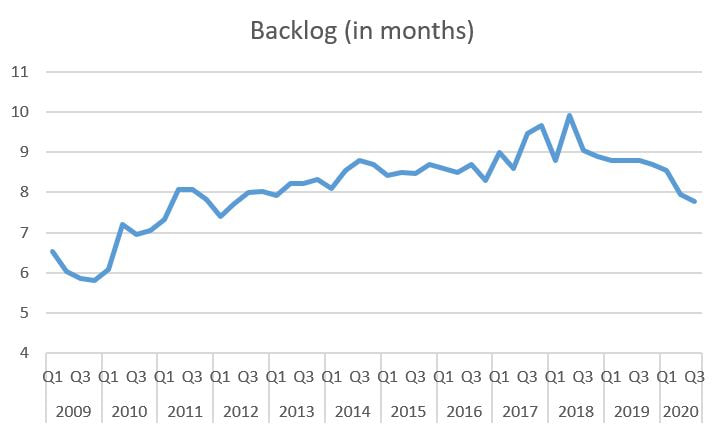 The details continue to be choppy. Let's start with the details by industry sector for September:
 Interestingly, while I previously mentioned it is odd to see ABI for the South in third place, the backlog for the South was the only gainer this month. The details are as such:
 The closing data are backlog by contractor size. The month-to-month data decreased with one exception:
 2020 is such a different environment that 2019 but the construction industry has stabilized after some sharp economic declines earlier this year. Given the continued drama around COVID and the upcoming presidential election, hopefully the industry holds steady with two small steps forward for every one small step backwards.
The building has been opened up and the geopiers were quickly installed last weekend (I apologize for missing that...). |
Archives
January 2024
Categories |
 RSS Feed