Builder blog

Current events and commentary regarding the construction industry. Opinions are my own.
Justin Reginato, Ph.D.
  • About
  • Builder Blog
  • Tacos & Tower Cranes
  • In the News
  • For Students

Checking in on the AIA ABI

8/29/2019

0 Comments

 
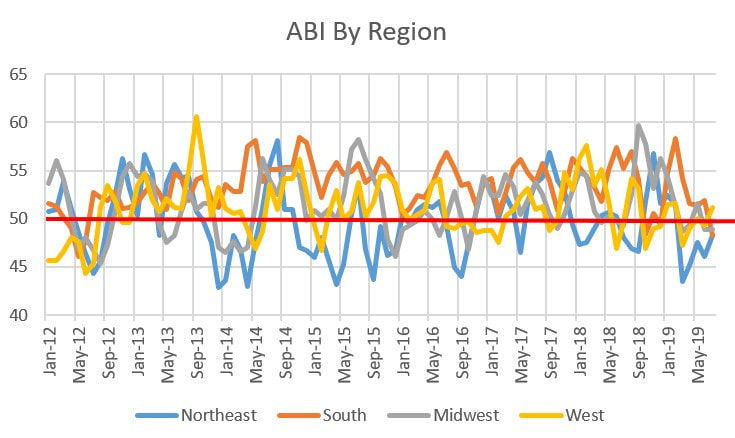
Wow...it has been a while since I've posted. Over a year ago, I posted about eight months in a row of growing architectural billings. Since then...meh. Let's look at the July 2019 numbers (posted on August 21, 2019). The Architectural Billing Index reported by the American Institute of Architects clocked in at 50.1, up from 49.1 in June. Project Inquiries came in at 54.9, up from 50.3 in June, however the Design Contracts Index decreased from June's 50.3 to 49 in July. As a reminder, any value greater than 50 means that architecture billings are increasing; conversely, any value less than 50 means billings are decreasing. The ABI is a leading indicator of commercial building construction by approximately nine to 12 months. So we have been essentially flat lining for a few months (50.3 in February, 47.8 in May, 50.5 in April, 50.2 in May and 49.1 and 50.1 in June and July respectively). This span has provided the first values less than 50 since September 2017. Time to panic? Short answer: no. The design and construction industry has been very hot, like the rest of the general economy, for a while. The economy is slowing, but it's not slow.
Picture
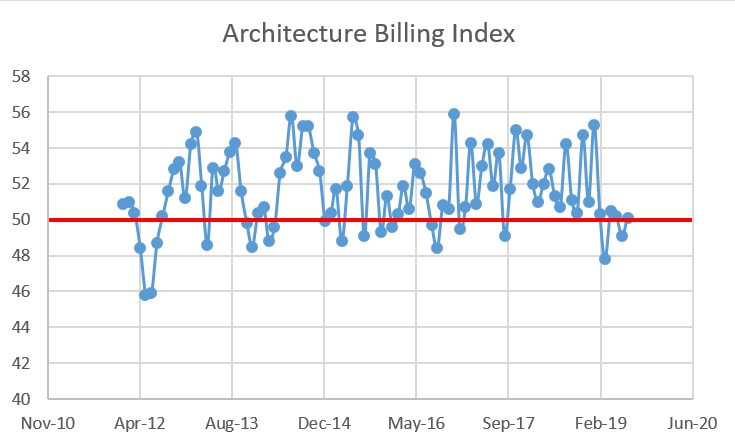
Here's is the regional breakdown for July 2019:
  • West: 51.2 (up from June's 49.3)
  • Northeast: 48.3 (up from June's 46.1 figure but this is five months in a row of sub 50 performance)
  • South: 48.3 (this is the first time in 84 months the South has been below 50, which was in June 2012)
  • Midwest: 48.9 (flat from last month)
Like I said, meh. Three out of four declining, but nothing to panic over. Hey, let's hear it for the West!
Picture
Sector Averages for July 2019:
  • Multi-family Residential: 50.6 (up from 46.3, ending four months of sub 50 performance)
  • Commercial/Industrial: 49.2 (versus 52.3 in June, a noticeable drop)
  • Mixed Practice: 48.9 (down from 54.3, a more noticeable drop)
  • Institutional: 49.8 (up from June's 47, the fifth month in a row below 50)
Picture
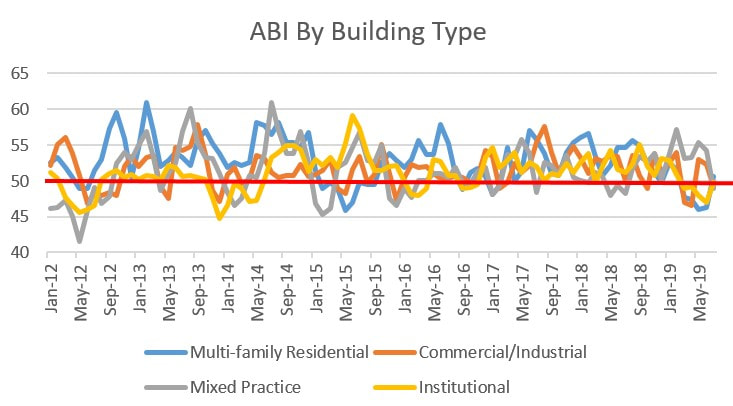
So yes, things are slowing from an ABI perspective. Given these trends over the past 5-ish months and ABI's status as a 9-12 month leading indicator, I would construction starts to begin slowing in the next half-year or so. More on that soon...
0 Comments

    Archives

    January 2024
    October 2023
    August 2023
    July 2023
    May 2023
    April 2023
    March 2023
    February 2023
    January 2023
    November 2022
    October 2022
    September 2022
    July 2022
    June 2022
    May 2022
    April 2022
    March 2022
    February 2022
    December 2021
    November 2021
    October 2021
    September 2021
    August 2021
    July 2021
    June 2021
    May 2021
    April 2021
    March 2021
    January 2021
    December 2020
    November 2020
    October 2020
    September 2020
    August 2020
    July 2020
    June 2020
    May 2020
    April 2020
    September 2019
    August 2019
    September 2018
    June 2018
    April 2018
    March 2018
    February 2018
    January 2018
    March 2016
    February 2016
    January 2016
    November 2015
    February 2015
    December 2014
    November 2014
    September 2014
    August 2014
    July 2014
    June 2014
    May 2014
    April 2014
    March 2014
    February 2014
    January 2014
    December 2013
    November 2013
    October 2013
    July 2013
    April 2013
    March 2013
    February 2013
    January 2013
    December 2012
    November 2012
    July 2012
    May 2012
    April 2012
    February 2012

    Categories

    All
    Economics
    Real Estate
    Technology

    RSS Feed

Proudly powered by Weebly
  • About
  • Builder Blog
  • Tacos & Tower Cranes
  • In the News
  • For Students