|
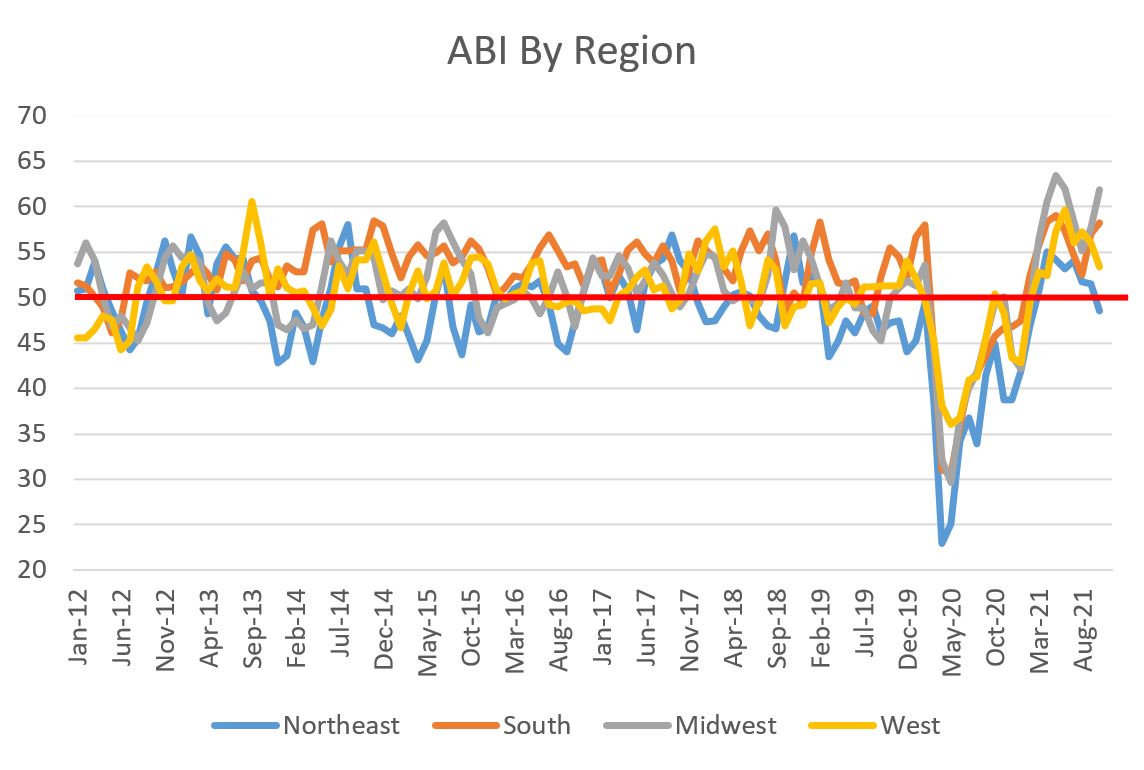
The American Institute of Architects (AIA) released the October Architecture Billings Index (ABI) last week and the value for last month came in at 54.3. This is lower than September's 56.6 and represents the first decline in the rate of billing increases since July 2021, yet to be clear, billings are still increasing. A value greater than 50 means that architecture billings are increasing; conversely, any value less than 50 means billings are decreasing. The ABI is a nine-to-12 month leading indicator of commercial construction activity. The database I have constructed contains ABI data going back to January 2012 (118 months). The 118-month average ABI is 50.9, so October's 54.3 is a historically healthy measure. 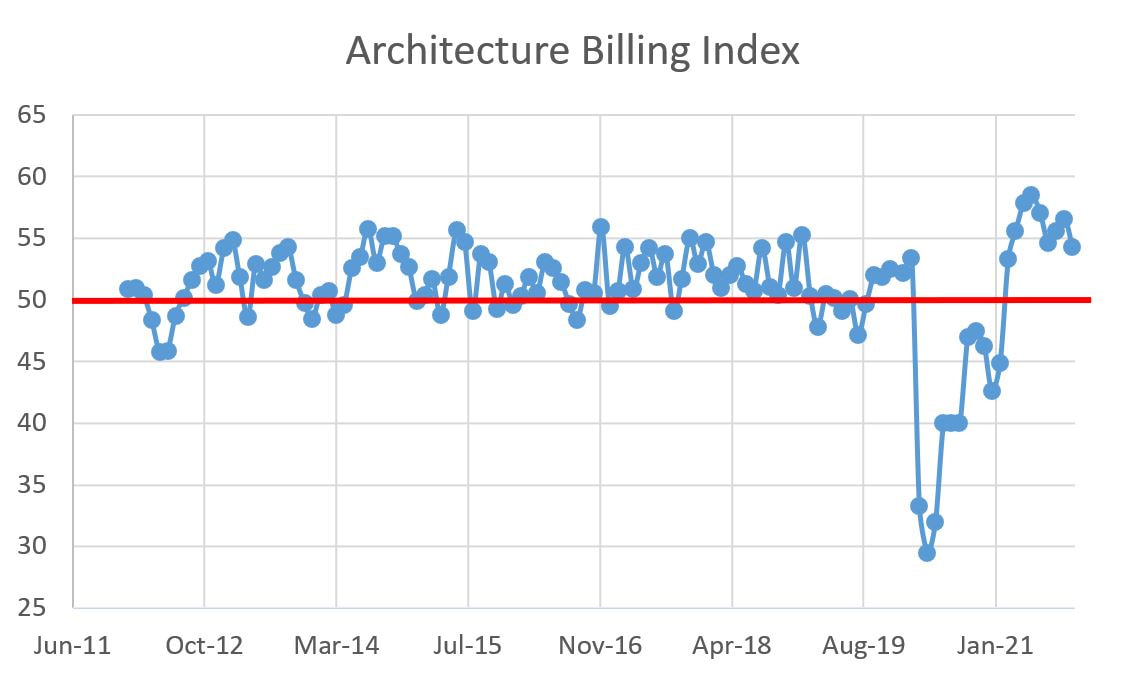 In terms of ABI subset data, there was one sub-50 category last month versus seven 50+ measures. The geographical breakdown is as follows:
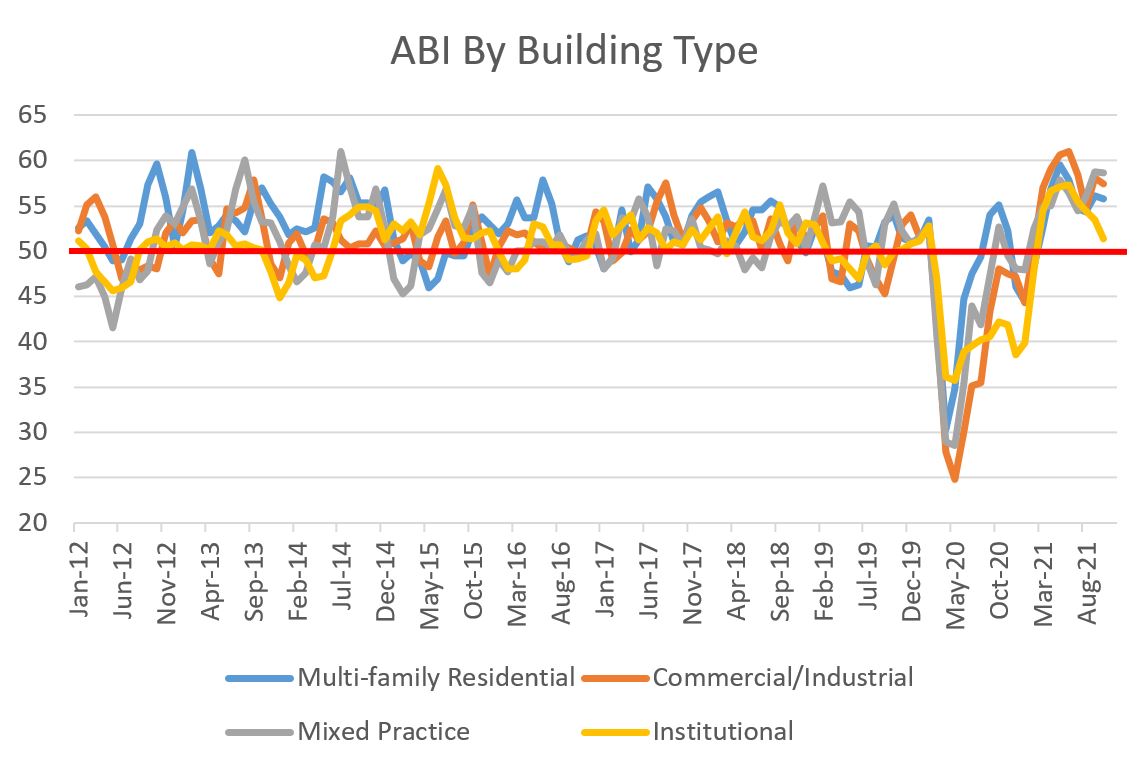
 For the sector breakdown, all were above 50, with Mixed Practice leading the way.
 Project inquiries were up in October, increasing to 62.9 over September's 61.8, showing strong interest in design services.
Overall, the ABI numbers are slightly lower on balance than last month with a few localized exceptions. That said, the numbers are pretty robust and demonstrate demand for design services which should translate to continued demand for construction services.
1 Comment
There are a few things I have been trying to wrap my mind around and it started with a conversation I had with a colleague recently. At the beginning of the pandemic, the institution for which I am employed went into full damage control. We put projects on hold, froze hiring and ultimately offered fairly generous (for a state bureaucratic agency) early retirement packages. We expected construction project funding to dry up on campus as state financial resources were likely to be reallocated towards fighting the COVID-19 pandemic. Much to our surprise, we are busier than we have ever been. While our construction projects were temporarily put on hold, they resumed just as soon as we and our contractors could put COVID prevention/containment protocols in place. Couple that with federal funds for COVID relief and pandemic preventative measures (aka the Coronavirus Aid, Relief, and Economic Security Act, a $2.2 trillion program, of which $14 billion was earmarked for higher education via the Higher Education Emergency Relief Fund) and we are absolutely slammed with work on our campus while we are dealing with a reduced workforce. Many of the contractors working on our campus have lamented the lack of skilled labor as an impediment to completing their current projects, let alone taking on more work in a busy market. While a lot of press attention is dedicated to the skyrocketing cost of materials due, in major part, to COVID-related supply chain issues, I am curious about the role of wage increases (due to labor supply and demand imbalances) on the overall discussion regarding inflation. This led me to this question: is the current construction workforce doing more work that it has over previous periods of time? In investigating this question, I did a quick-and-dirty analysis that I will present below. However, I want to start with some caveats. First, my analysis discounts the adoption of technology in the construction industry. Construction is very likely seeing the productivity gains most other industries enjoyed with the adoption of widespread technology upgrades. The construction industry largely missed this trend in the early decades until hardware became portable and inexpensive enough to be utilized on a construction project site. Similarly, I did not dig into the use of robotics as a source of productivity enhancement, nor did I analyze the impacts of the adoption of lean production techniques on construction projects, both of which improve labor productivity. Rather, I focused very high level and wanted to determine if people working in construction are performing more work than they had in the past, and if so, how much more. To answer this question, I utilized two sets of data, Total Construction Spending in the United States and All Construction Employees in the United States. Next, I combined the data into a single metric, Construction Spending per Employee, which is plotted below: 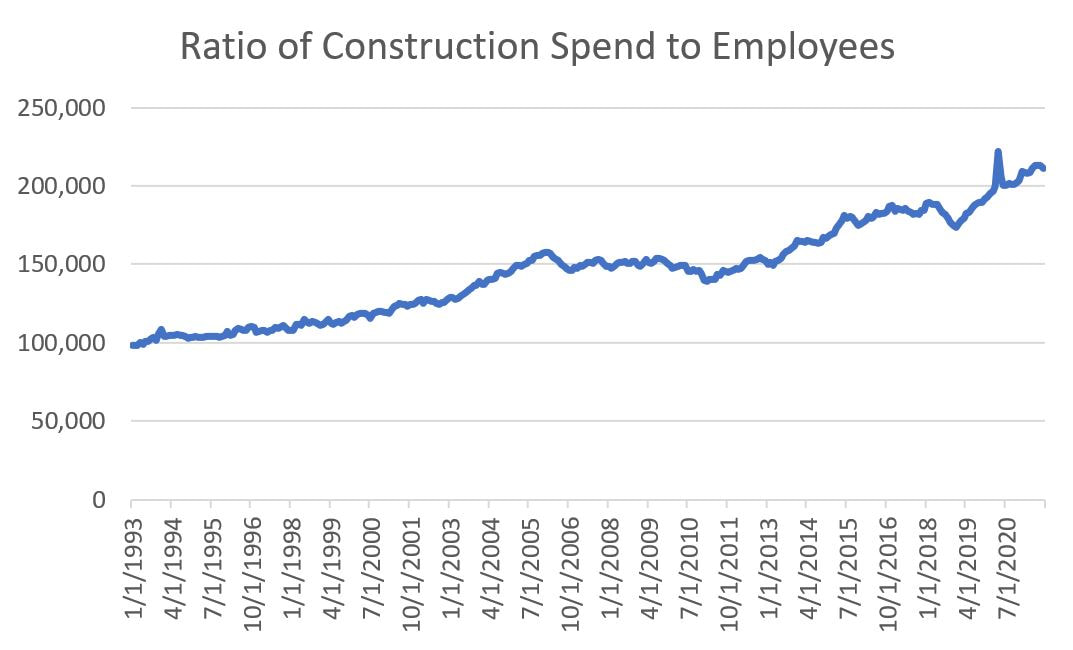 Clearly, we are completing more work per employee today than we were in the past. For example, in January of 1993, there was one member of the construction industry for every $100,000 of construction spending ($98,216 to be exact). In September 2021, there was $211,109 of construction spending per employee. This represents approximately 0.22% compounded monthly increase over that period of time. But look at how the curve is particularly steep from December 2018 to present. Over that period of time, the compounded monthly growth rate is 0.60%. While these percentages may appear small, the increases over the past three years are quite profound. So what happened in 2018 to cause this dramatic increase in construction spend per employee? Looking at the increase through the most simplistic lenses, it could be due to a decrease in construction employment and/or an increase in construction spending. The change in construction industry employment is shown below. While our current national construction industry employment of 7.5 million is down from peak employment in April 2006 (7.73 million people working in construction), we are way off the lows of 5.48 million in March 2011. Since December 2018, employment has increased 1.1%. 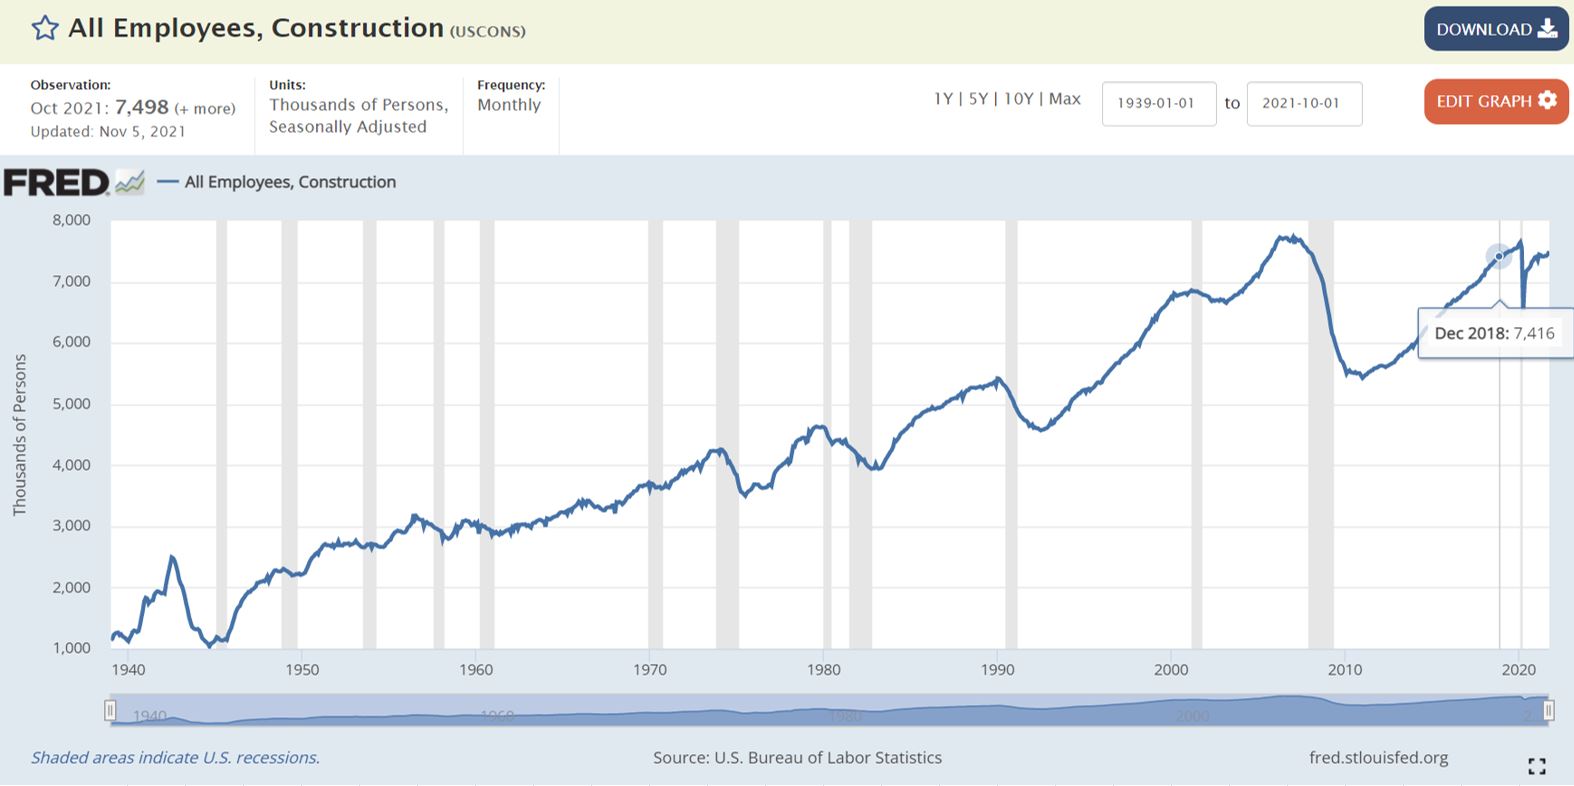 Construction spending, on the other hand, has skyrocketed since December 2018, from $1.28 trillion to $1.57 trillion. This constitutes an increase of 22.7%. So, with marginal increase in employment and a large increase in construction spending, the steep increase in the ratio of construction spending per employee since 2018 is due to increased spending (neglecting all outside factors). 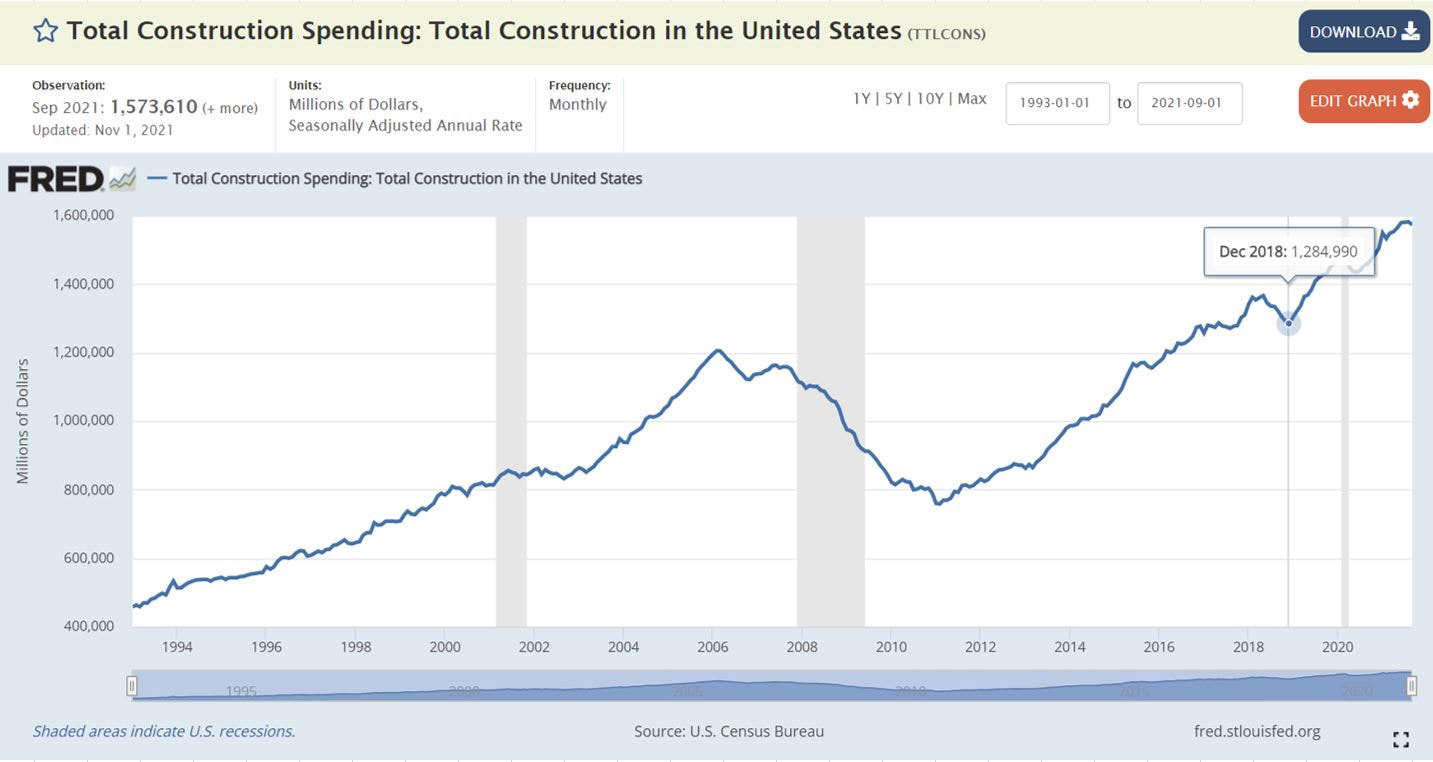 So we are doing more work with essentially the same number of employees we had in 2018. This is not necessarily a bad turn of events. It could be that we are capable of doing more work per employee due to the adoption of productivity-enhancing technologies, lean production techniques, training and skill enhancement, etc. I do believe that productivity increases are real and due in no small part to technology and lean implementation. That said, given the chorus of warnings from contractors regarding the quantity of skilled labor as an impediment to getting the current increasing backlog of work completed, I an inclined to believe the increase in work is outstripping the bandwidth of the current construction workforce. Without increased technology adoption AND a strong inflow of construction personnel, we run the risk of overworking our current workforce and leaving a lot of projects at the starting gate.
|
Archives
January 2024
Categories |
 RSS Feed