|
Yup, two blog posts in one day. With the taxes I pay on the income that comes from delivering these pithy insights, the economy will be back in no time! So I like to present the AIA ABI data as a leading indicator of where the construction industry is heading, but it is just a proxy for the construction industry. Let's take a minute to discuss a metric that is directly related to the construction industry. It so happens that the Associated Builders and Contractors (ABC) has such a metric: the Construction Backlog Indicator (CBI). What if the CBI presents a better picture that the ABI? Maybe things are not that bad. Well...they are not great. The CBI is the number of month's worth of work under contract. The numbers have been falling since January. While ABC provides monthly data, I have some questions about the data. ABC typically reports a month's data approximately 1.5 months later, so January data would be reported mid-March. However, April's data was presented in in May. Also, and even more puzzling, the reported data for February and March 2020 are exactly the same. This is all inside baseball, but I have rolled the data up into quarterly results instead of monthly. But back to the results. January showed an average backlog of 8.9 months. The "April" values released last week showed an average backlog of 7.8 months. While 1.1 months may not seem like much, it is a drop of over 12%. 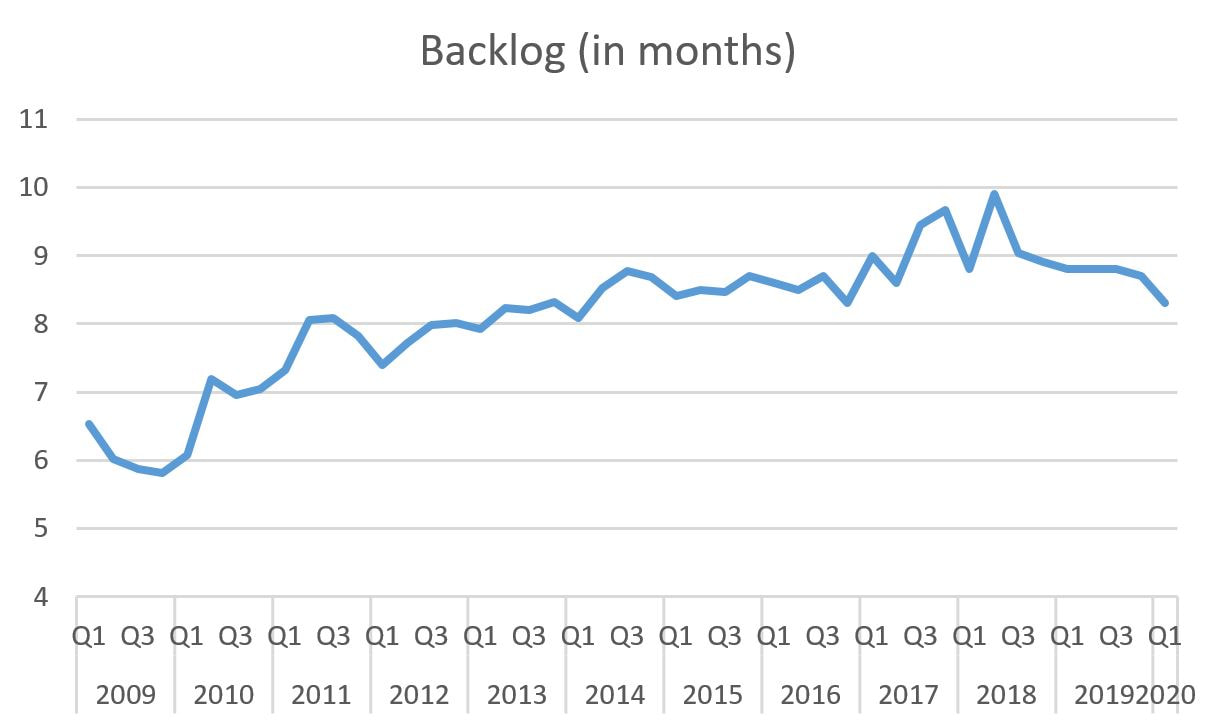 2017 and 2018 were spiky but pretty good. But in mid-2018, backlogs began to slide and the first quarter of 2020 they began falling. The ABC data allows for some drilling down. In terms of industry sector, backlogs have been falling since the second half of 2019 and accelerating for the heavy industry and infrastructure sectors in the first quarter of this year. 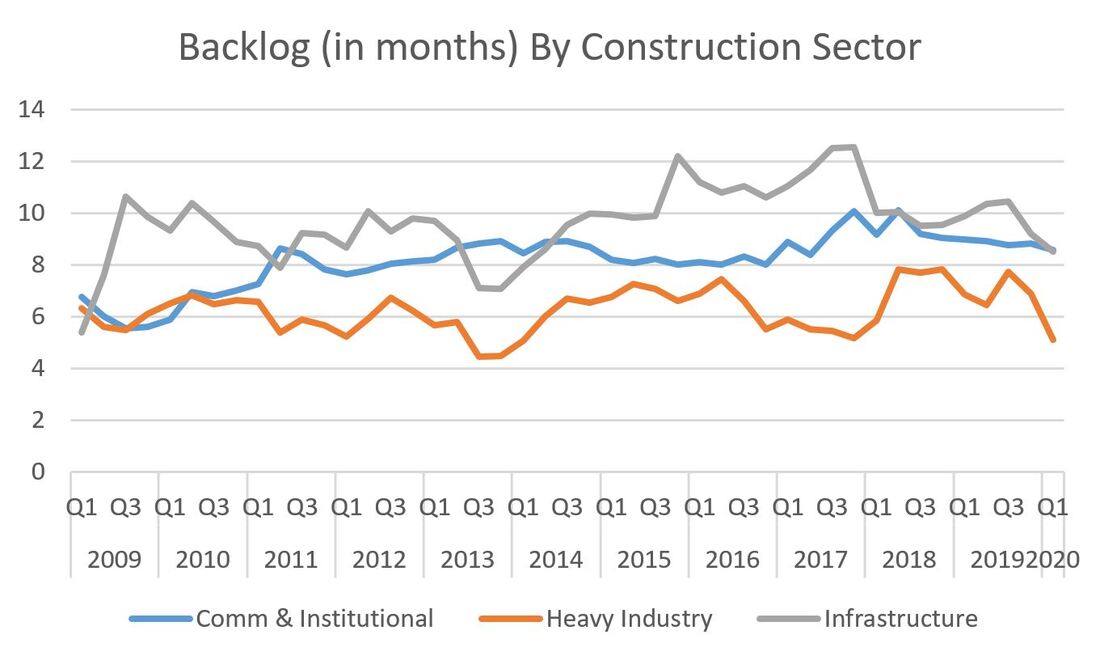 Decreases in backlogs by geographic region are far less pronounced as the data is pretty choppy. Interestingly, the West saw an increase in backlog in Q1 2020, but we will see if that continues next month. Metropolitan areas in California and Washington were hit particularly hard by COVID-related project shutdowns (which could be good or bad). 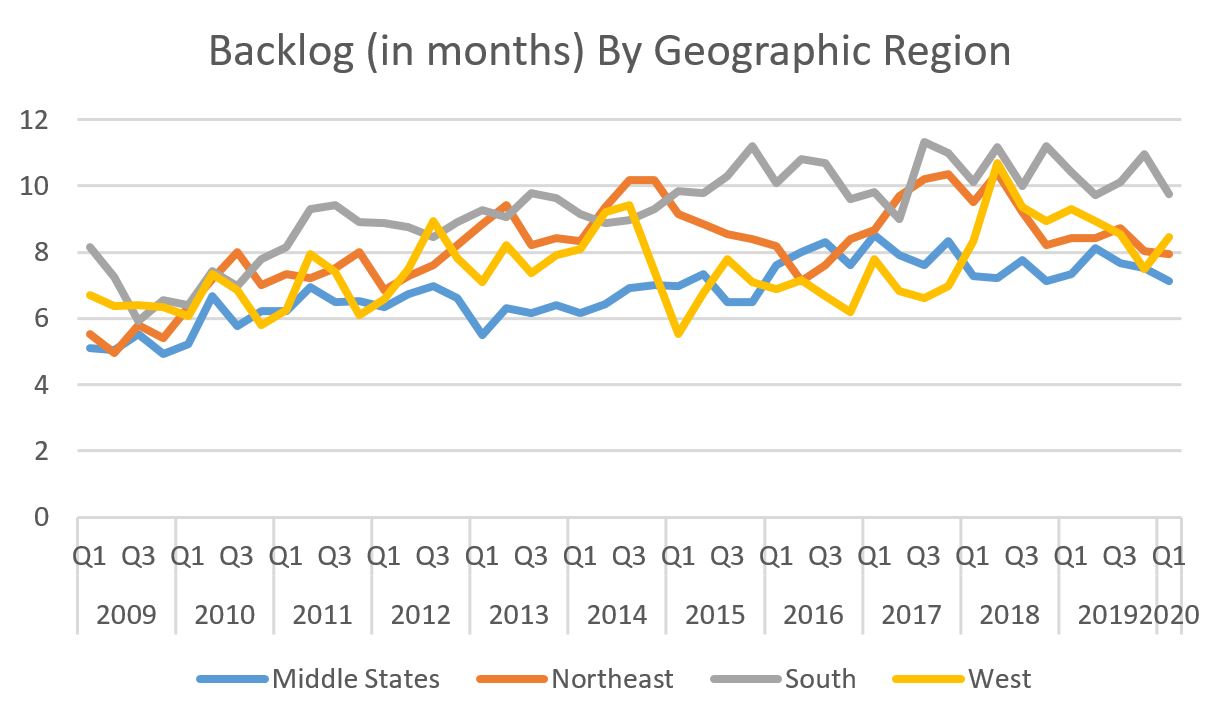 Last is a graph of backlog by contractor size (in dollar volume). Smaller contractors have been fairly consistent with approximately eight months of backlog since 2016. But all of the larger segments have seen a sharp decline in backlog since Q4 2020. 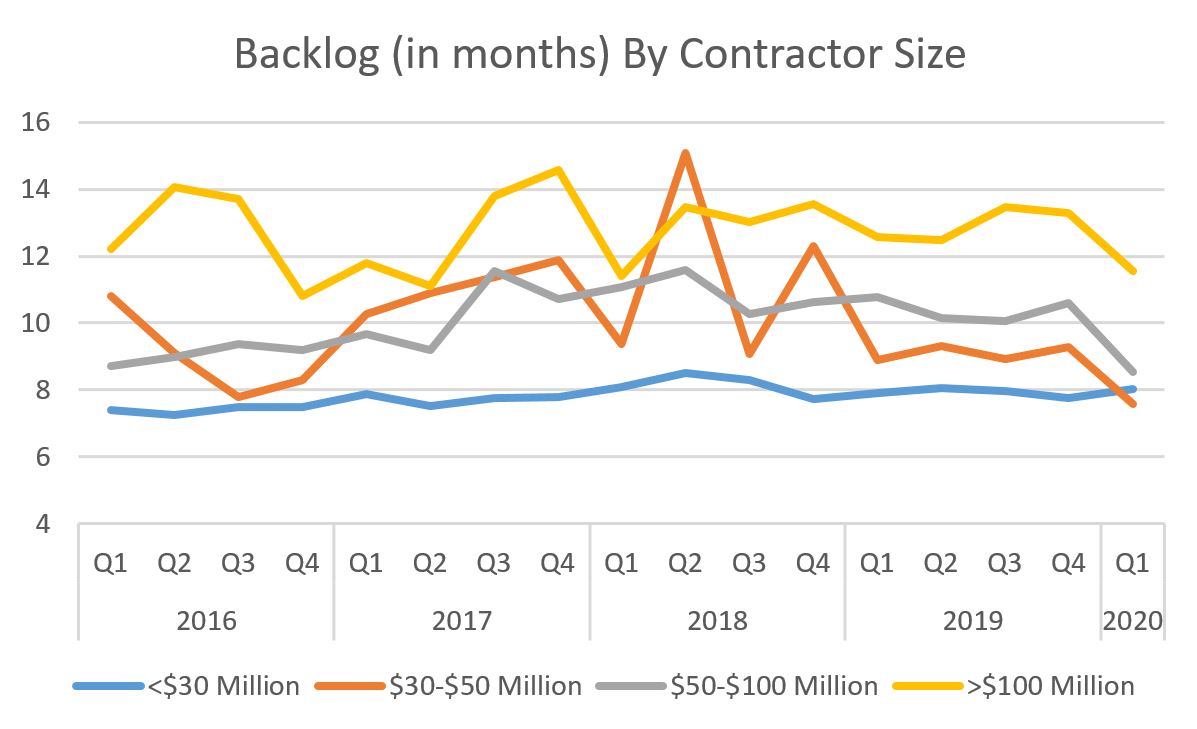 So backlogs have generally been falling since 2019 but haven't seen the perilous drop that the ABI has seen in recent months. But by combining both factors, it looks as if the construction industry started slowing in 2019 and will likely hit the skids in the second half of 2020. Not great news, but perhaps this will be enough to encourage bi-partisan efforts to fund infrastructure improvements (hey, let's try to find a silver lining somewhere).
0 Comments
Leave a Reply. |
Archives
January 2024
Categories |
 RSS Feed