|
I could not tell heads from tales this morning as I scrolled through my e-mail. In today's installment of the Construction Dive daily brief, there were two articles that seemed to be talking in circles:
So what is going on? In reductive terms, there is a lot of pent up demand for structures, particularly housing, and contractors are very busy. However labor and materials are both hard to get and expensive when found. This tension showed itself in the past four months' worth of Architectural Billings Data published by the American Institute of Architects (AIA). The Architecture Billings Index (ABI), a nine-to-12 month leading indicator of commercial construction activity, bounced along the low 50's from November to February (51/52/51/51.3 for those of you keeping score at home). Recall that values greater than 50 signifying increasing design billings and values less than 50 signifying decreasing billings. So four straight months of low 50's indicates modest and measured growth. So after reading today's (and the last month's) news, imagine my surprise when the March ABI, which was published today, came in at a very robust 58. This is the highest the ABI has been since May of last year and is way up from February's aforementioned 51.3. The summary and graphs are shown below, but the good news was spread far and wide and was particularly good for those of us in the West, which saw a jump of 12.7% from last month. The only month-over-month declines were a very modest decline in commercial billings and billings in the South (please note that the South has been on such a tear that this decline is the equivalent of someone taking a few seconds to catch their breath after a 100-yard wind sprint. In other words, totally ordinary). There are more declines in the year-over-year data, but those of you who have not been actively trying to forget the past year or so, you may recall that a year ago the market was muy en fuego after rising like a phoenix from the depths on the COVID-induced ABI chasm of two years ago. My simplistic view of the construction economy goes like this: COVID caused a tailspin in ABI, but once vaccines and a semblance of heard immunity was realized, the industry remembered we still need housing and other structures so the market roared back. Labor and supply chain constraints have cooled the temperature and forced modest growth over the past quarter or so, with March being a seemingly randomly strong month. I actually like this tension between strong demand and labor and material constraints because it keeps us questioning our assumptions. Every owner keeps ensuring their projects still pencil and contractors keep watching construction budgets like hawks. This tension did not exist in 2007 and high demand, easy capital, no constraints, champaign and cocaine (metaphorically speaking) all merged together and ended in a housing bust that was felt around the world. By themselves, I am not a fan of rapidly escalating labor and material prices, but I feel like they are pumping the brakes and keeping us from running off the road. Anyway, enough musing. The data is below: 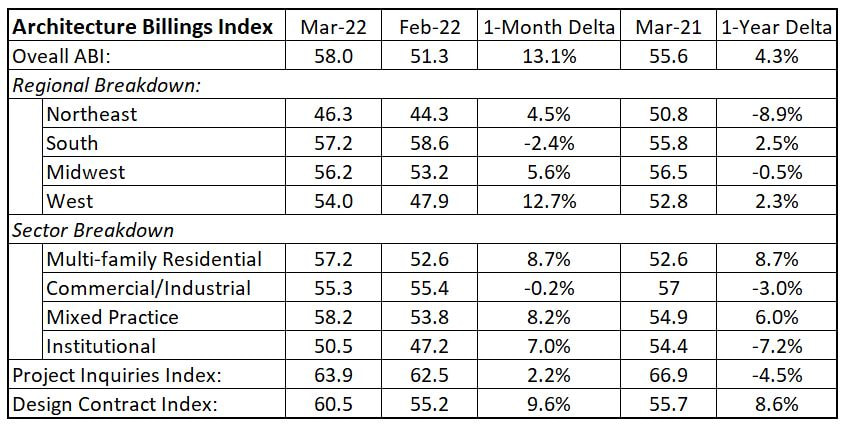 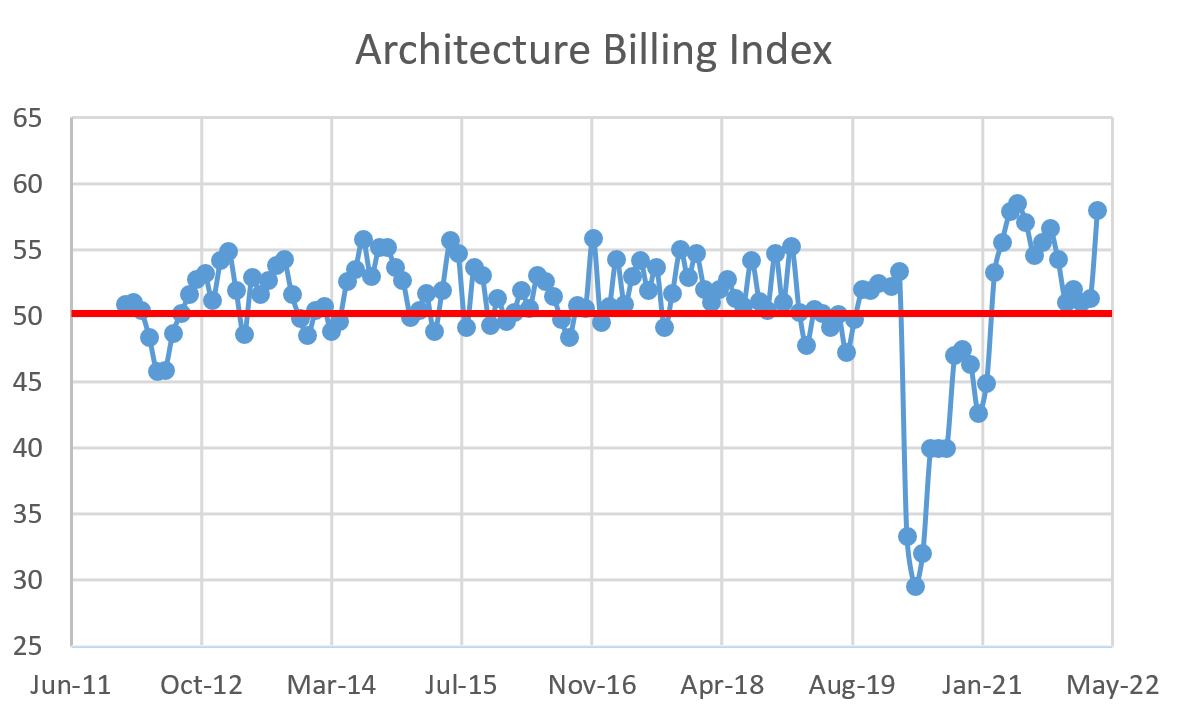 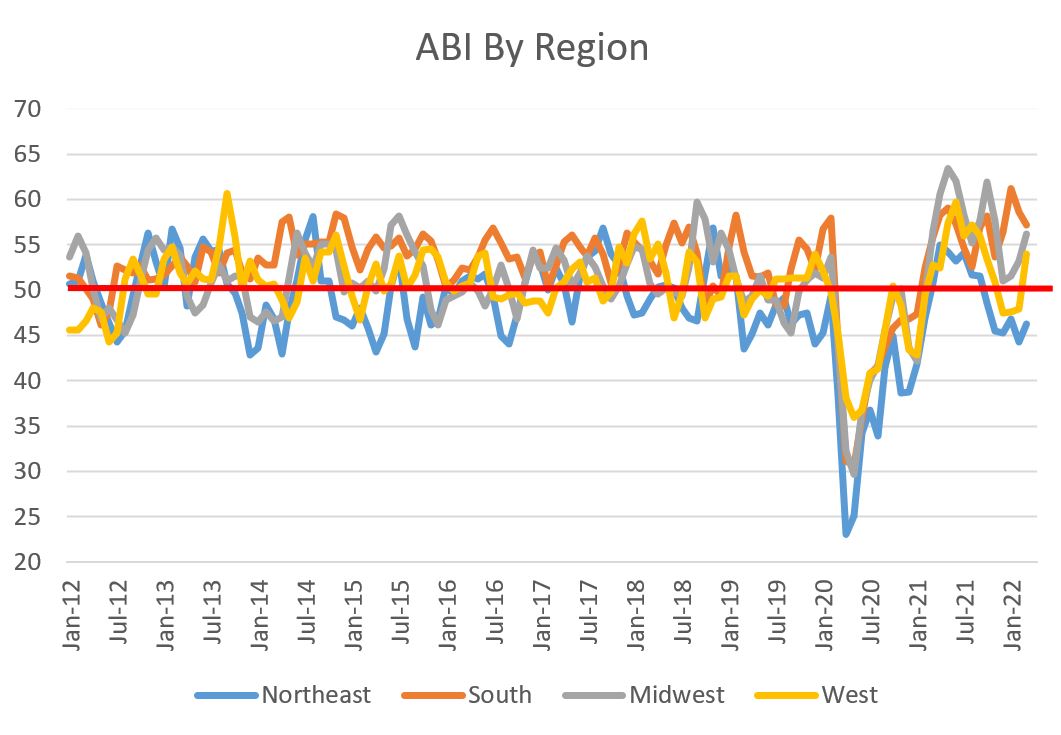 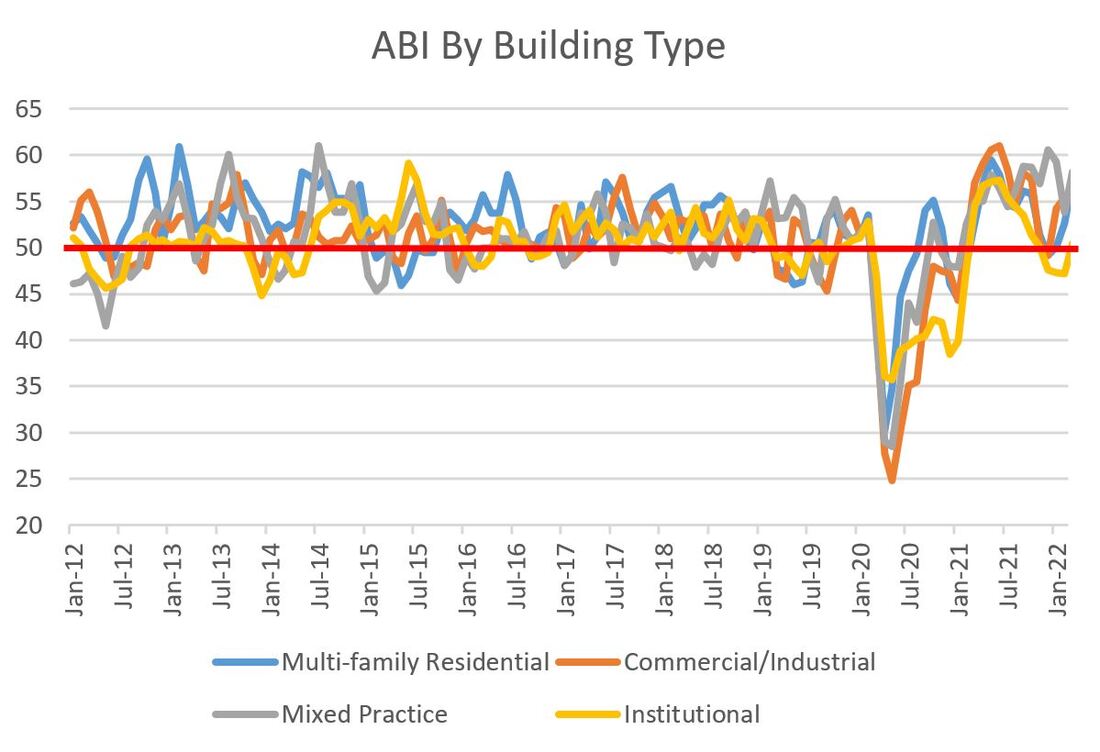 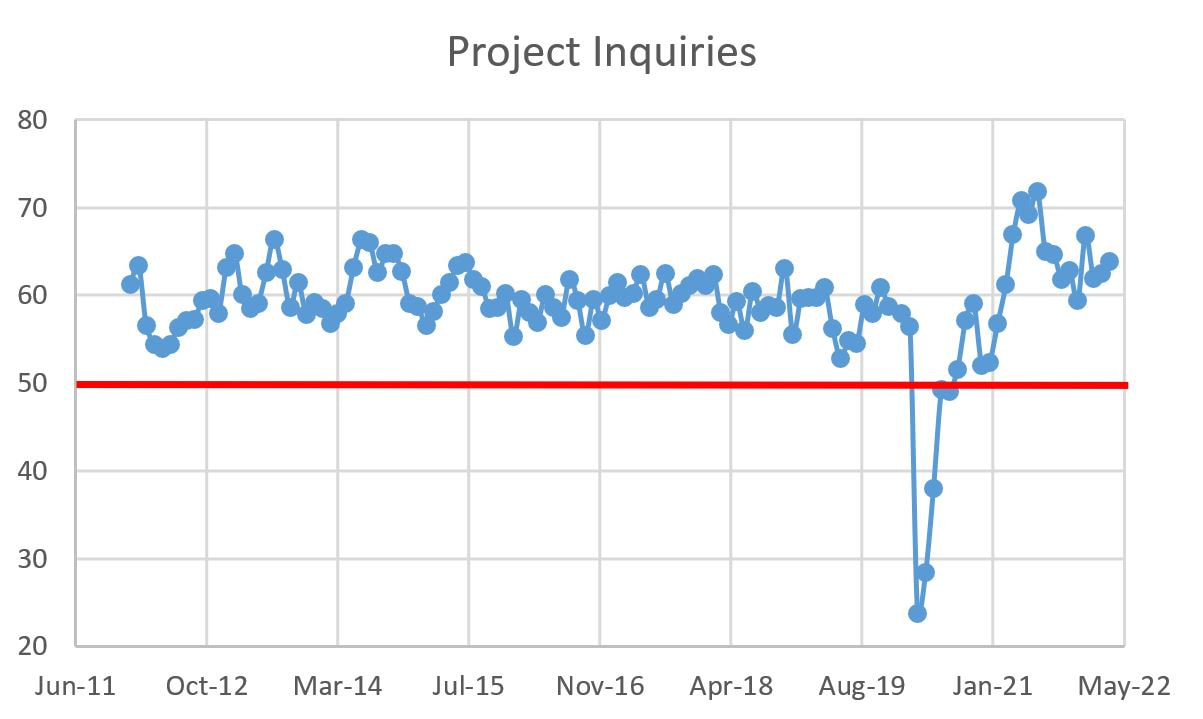 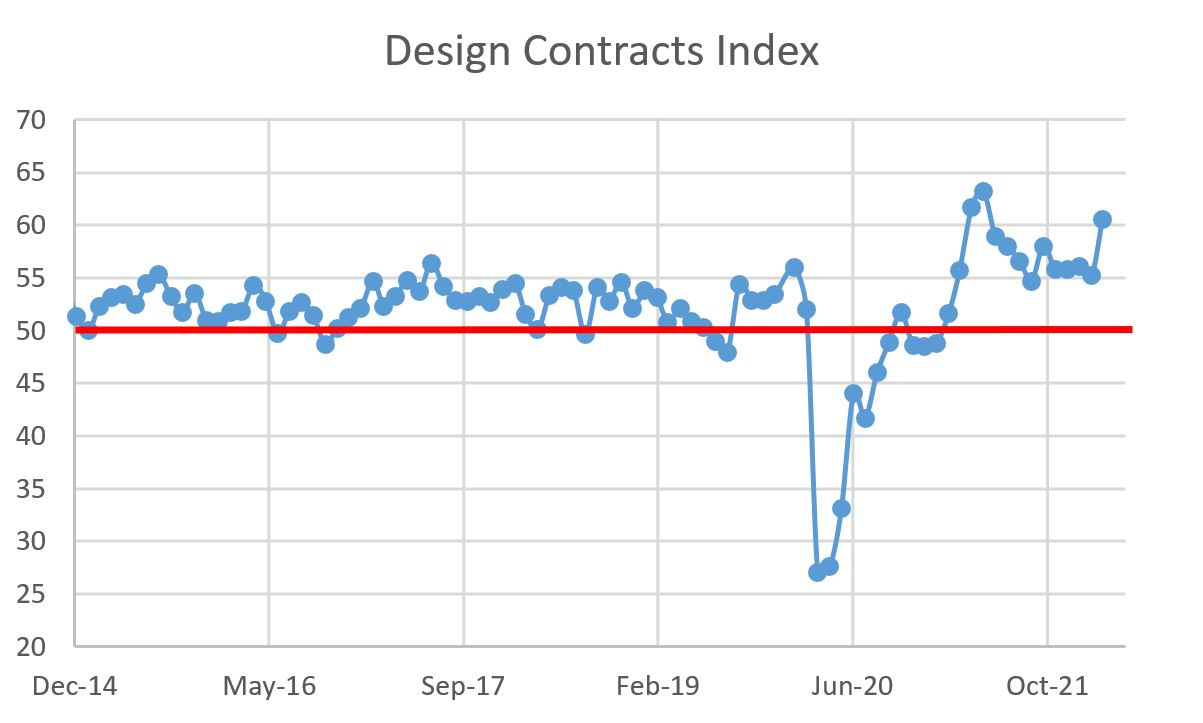
1 Comment
|
Archives
January 2024
Categories |
 RSS Feed