|
It has been a few months since I reported on architecture billings or contractor backlogs, and I kind of wish I remained in hibernation. While 2023 started off well enough, design activity turned sour around July. It is not all bad news, though. Contractor backlogs held steadier throughout the year, albeit with a dip in Q4. While this is predictable given the Fed Funds Rate increases, which were fully intended to pump the breaks on an overheated AEC industry, I didn't expect the design slowdown to happen so quickly or sharply. Using the data published by the American Institute of Architects in the form of the Architectural Billings Index (ABI), we can see how design activity has slipped in the second half of the year to levels not experienced since we crawled out of the COVID pit of doom. That is the bad news. The good news is that the last two readings have signaled a slight rebound. Again, this slowdown may be the industry coming to terms with the Fed Rate, which I have discussed recently. It is important to repeat that the ABI is a leading indicator of construction activity by nine to 12 months, so it foreshadows how busy contractors will be. 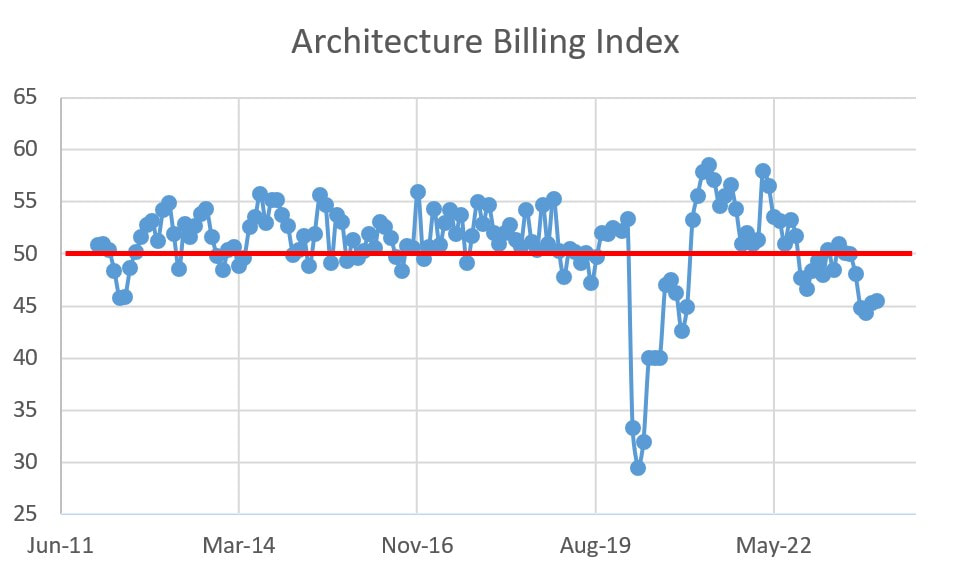 The data for the entire year is a bit manic. In spite of poor performance over the past six months, the month-over-month data is not too shabby. The South, long the darling of construction activity, was the only truly poor performer, and its cooling period was over the entire year. Aside from that, only Mixed Practice performed poorly year-over-year. Those two sub indices weighed heavily on the overall ABI, which declined 6% over 2023. All indices are below the 144-week averages and way below their highs. 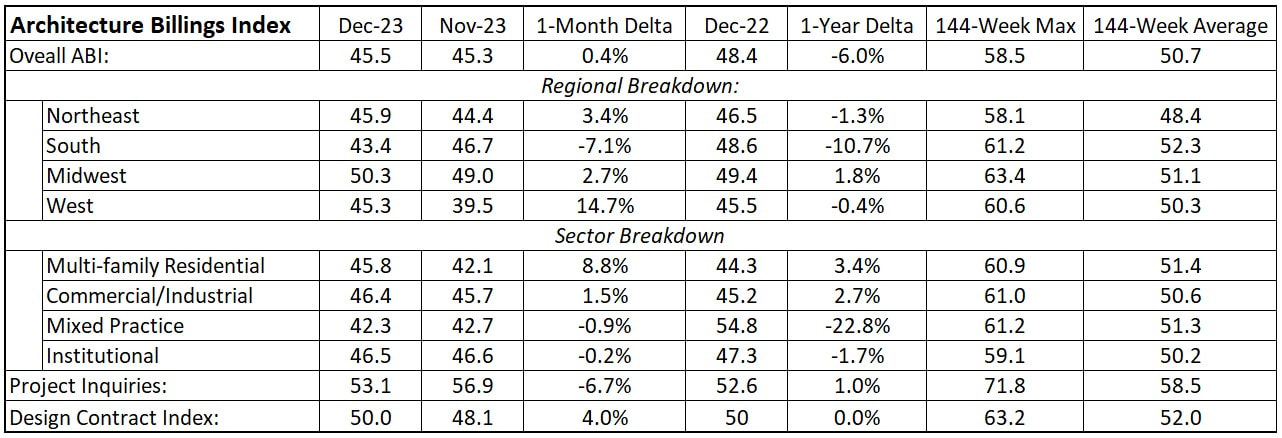 The finer details are articulated below in the other sub indices. Institutional design is weathering the storm better than most sectors and that is not completely surprising given government investment in infrastructure. That leads us to contractor backlogs. Using the Construction Backlog Indicator (CBI) index published by the Associated Builders and Contractors, we can determine in the here-and-now of how busy contractors are. Backlogs measure how much work contractors have banked. In the case of the data presented below, it represents how many months a contractor would stay busy without securing any additional work. When backlogs are high, contractors are relatively busy and have pricing power. When backlogs slip, contractors have less work lined up and, thus, lose pricing power. Overall backlogs have slipped over the last quarter of 2023, however they are still above the 59 month average. Additionally, many of the sub indices are up month-over-month. The year-over-year story is a bit different, with the overall backlog index down 6.5% and some big sub index losses, including Infrastructure (-21%), the Northeast (-10%) and contractors with $30 to $50 million in revenues (-15%) and those with revenues grater than $100 million (-25%). 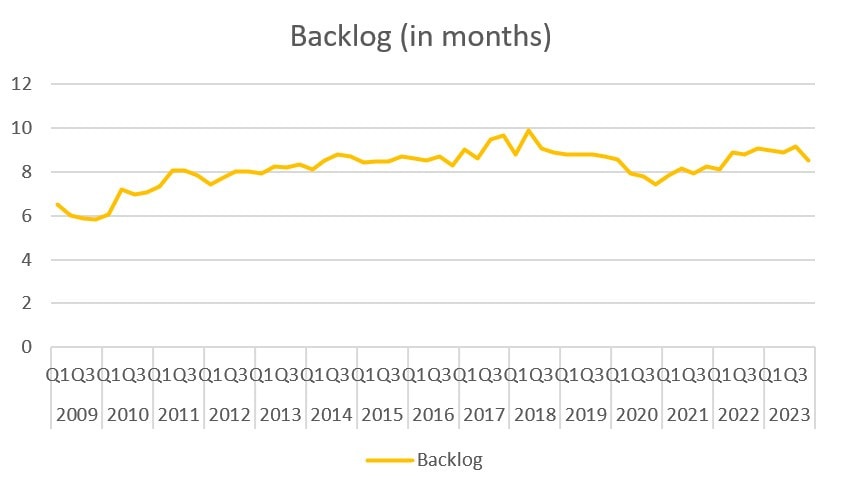 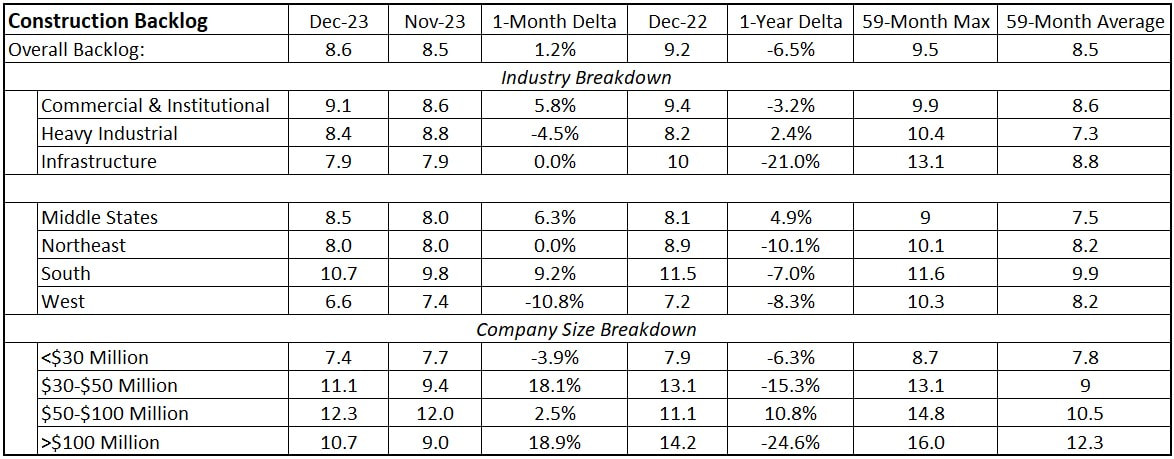 Based on the shape of the graphs (and giving grace to the differences in scales), it is clear that backlogs are less volatile that ABI. That said, in a perfect world, increasing ABI would be a catalyst for increasing backlogs, albeit with a nine to 12 month (give or take) lag. That said, given that the ABI started to struggle about six months ago, I would expect backlogs to continue their slipping over the first half of 2024. The light at the end of the tunnel is that the Fed is giving strong signals that it will decrease the Fed Rate in the second half of 2024. If the Fed handled the interest rate lever correctly, and there is strong evidence that it has shown great dexterity in cooling the economy without driving into the recession ditch, then the second half of 2024 may see increased design activity and the ABI rip north.
0 Comments
The Cost of Capital for Engineering-Construction Firms Dropped In Spite of Rising Fed Rate1/15/2024 A lot has been made recently about how an increasing Federal Funds Rate is elevating interest rates in general, making it more costly to finance purchases. While that may be true for the economy in general, the cost of capital for engineering-construction firms actually decreased year-over-year while the Fed Rate increased. 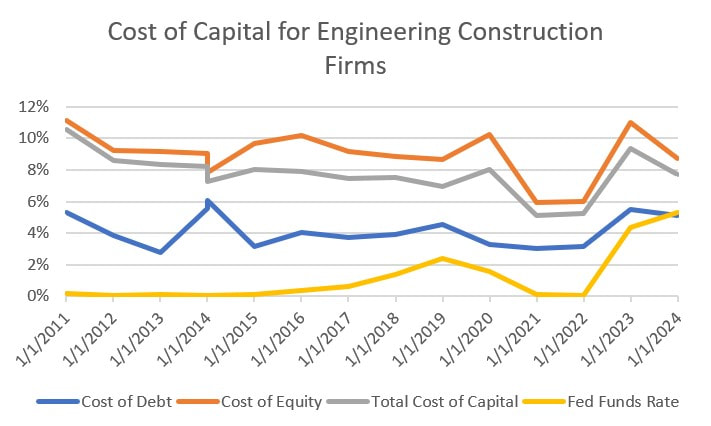 While to cost of both debt and equity lurched upward in lockstep with the Fed Rate between January 2022 and 2023, both the cost of debt and equity (and, in turn, the cost of capital) decreased between 2023 and 2024 while the Fed Rate increased. Why does this matter? Well, the cost of capital, which is a function of the cost of equity and debt, is the hurdle rate for justifying a capital investment. The higher the cost of capital, the more an investment needs to return in order to validate itself. The curve for the cost of capital mimics the Fed Rate, albeit with a 6%+ premium. One would expect that as the Fed Rate increases, so would the cost of capital. And that was the case for the previous 12 years. However, this year bucked the trend, and the costs of debt, equity and overall capital decreased even though the Fed Rate increased. This should make it easier for engineering-construction firms to invest in capital equipment, mergers and acquisitions, or other investments.
Last week, the Bureau of Labor Statistics (BLS) reported that 216,000 jobs were added to U.S. payrolls. This figure exceeded expectation and was well above the 173,000 jobs added in November. The surprise lies in that the increases in the Fed rate were intended to mute the hot job market. Job creation in the construction industry was particularly robust with the industry adding 17,000 jobs in December. While 17,000 positions was more than expected, it is in line with the average of 16,400 positions added per month in 2023 (in spite of a net loss of 9,000 jobs in March). An average of 22,000 per month construction jobs were added in 2022 (despite 4,000 construction jobs removed from the U.S. economy in January 2022). 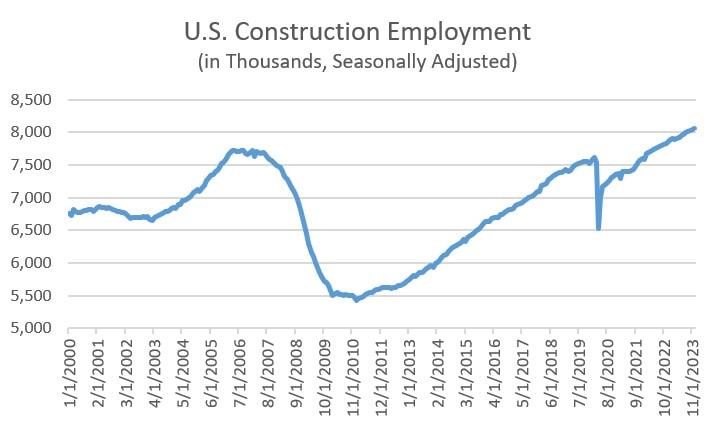 Most construction industry practitioners have been struggling to find employees for years and acutely since the market rocketed up from the COVID implosion. And the two years of gains have helped, yet we can anticipate the need for greater numbers entering the construction workforce. Total construction employment increased 2.2% in 2023, while total U.S. construction spending increased 11.4%. 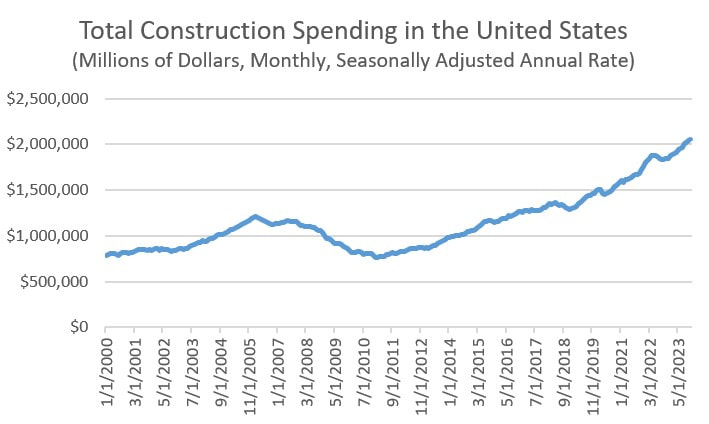 As long as construction spending continues at its current rate, which with government investments in infrastructure should be expected, we will continue to need even more people to enter the construction industry.
|
Archives
January 2024
Categories |
 RSS Feed