|
Hello 2022! This is the first construction economics post of the new(ish) year because I put my energies last month into my 2022 Construction Financial Management Association (CFMA) economic forecast presentation (which can be found here). We are off to a good start in 2022, with the Architectural Billings Index clocking in at 51. The American Institute of Architects (AIA) publishes the Architecture Billings Index (ABI) and values greater than 50 constitutes that architecture billings are increasing, while a value less than 50 means billings are decreasing. The ABI is a nine-to-12 month leading indicator of commercial construction activity. Since 51 is (checks notes) greater than 50, billings grew in January. Yay...sort of. January was down from a measure of 52 in December. Per the press release issued by AIA: “Architecture billings, while remaining at very healthy levels in recent months, have slowed considerably from the middle of last year,” said AIA Chief Economist, Kermit Baker, Hon. AIA, PhD. “This no doubt reflects delays in the construction sector caused by supply challenges for both labor and materials, as well as ongoing staffing constraints at architecture firms.” So many of the know headwinds in the industry, such as material cost escalation and a lack of labor, are starting to take root and have negative consequences. The big outstanding question is whether or not this downward trend will continue such that we see a contraction in ABI which would predict a slowing in construction starts. In the meantime, let us just enjoy that the market is healthy and that the ABI is a tick above its average dating back to 2012 (50.9). In particular, take a look at where we were one year ago; in every category except Project Inquiries, the granular ABI figures are up by over double digits. The breakdowns are below in a new table format (with the historical graphs in tow). I hope you like this new format. 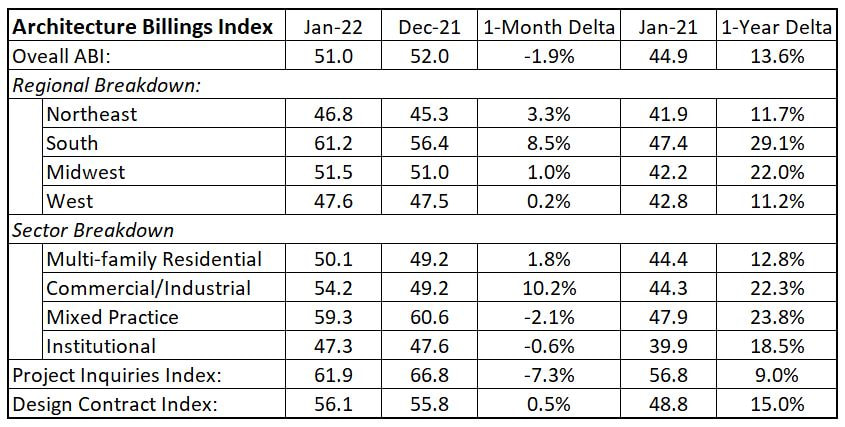 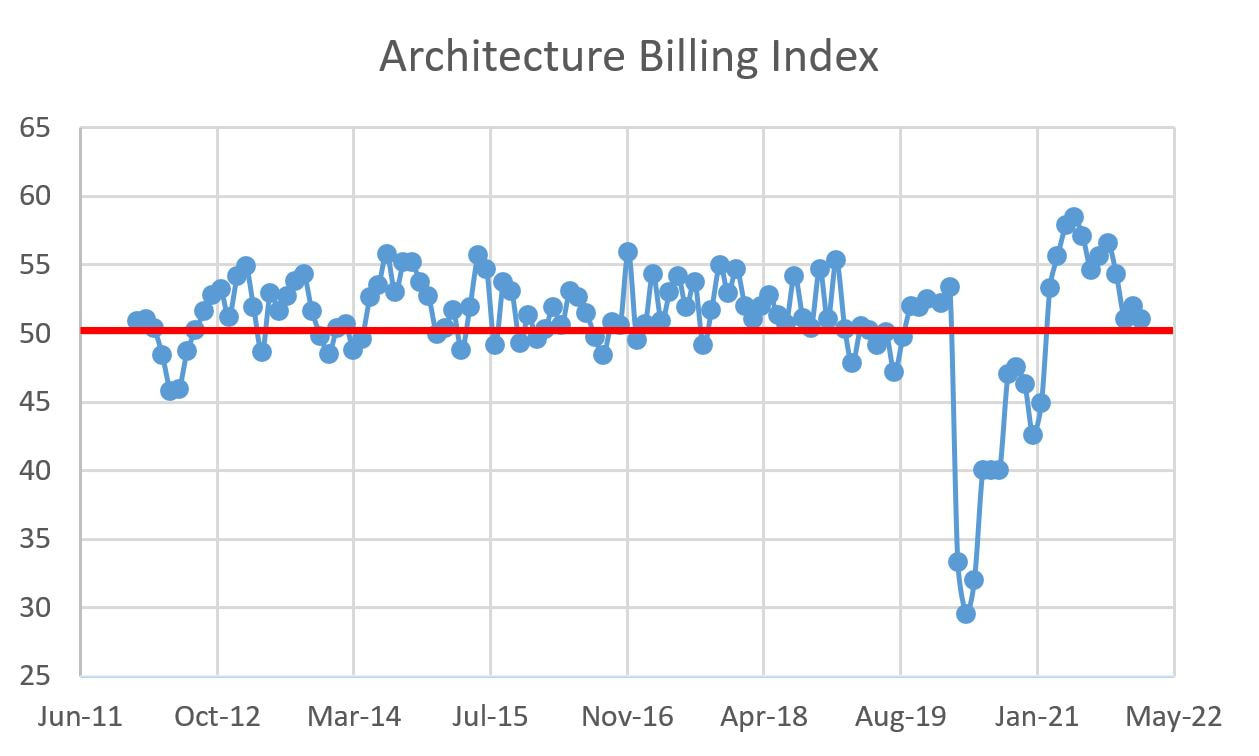 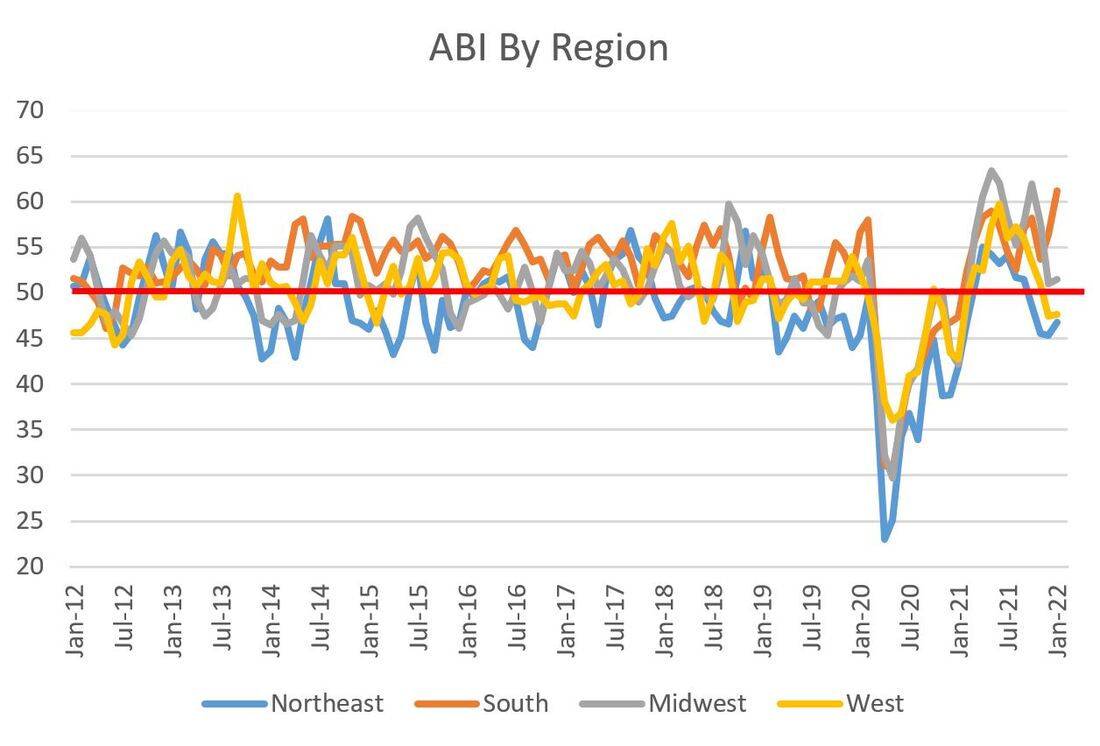 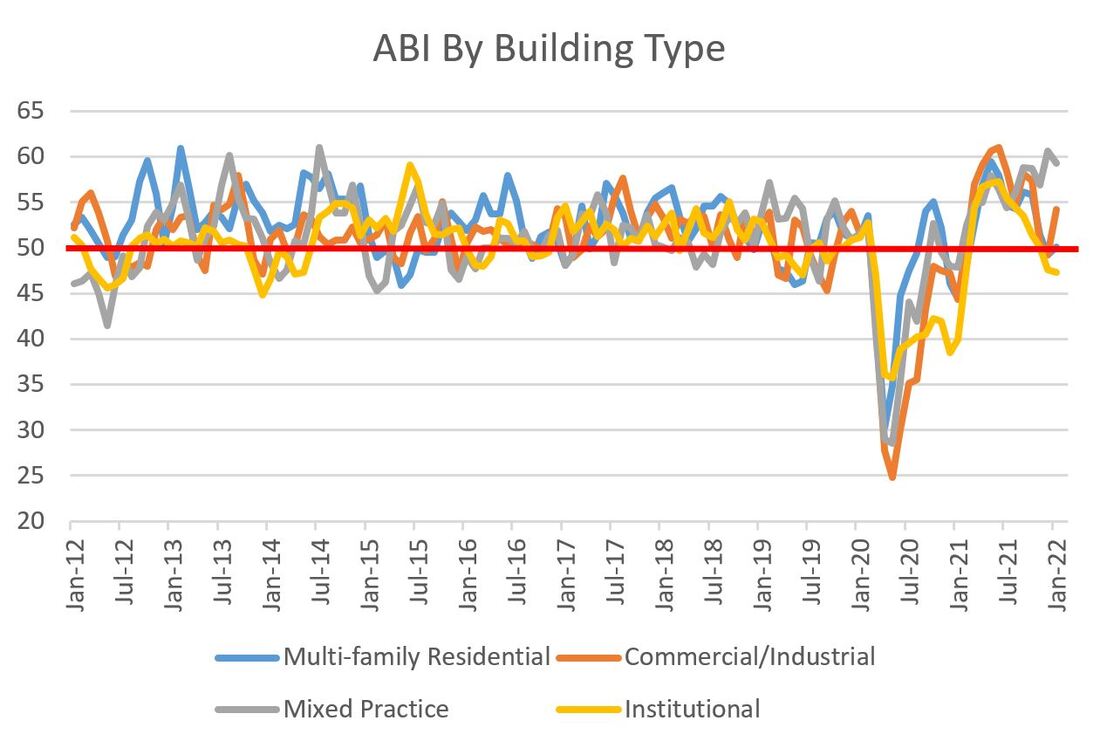 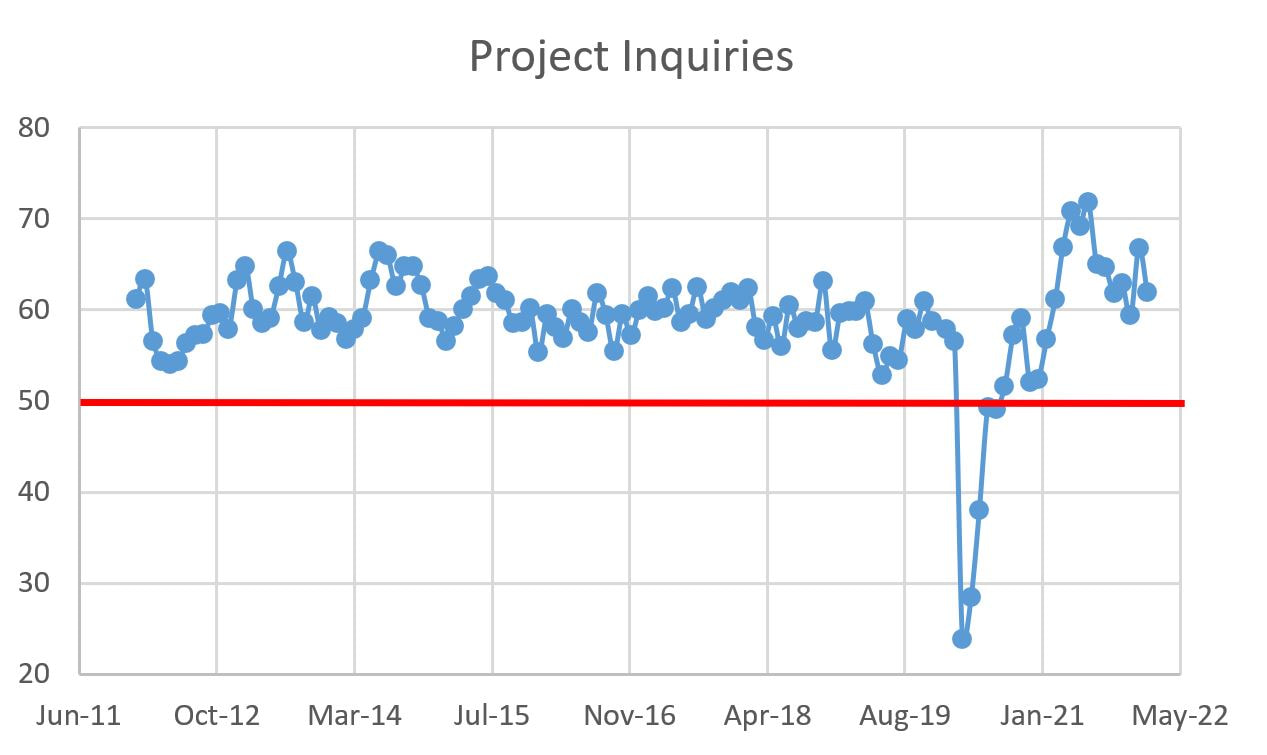 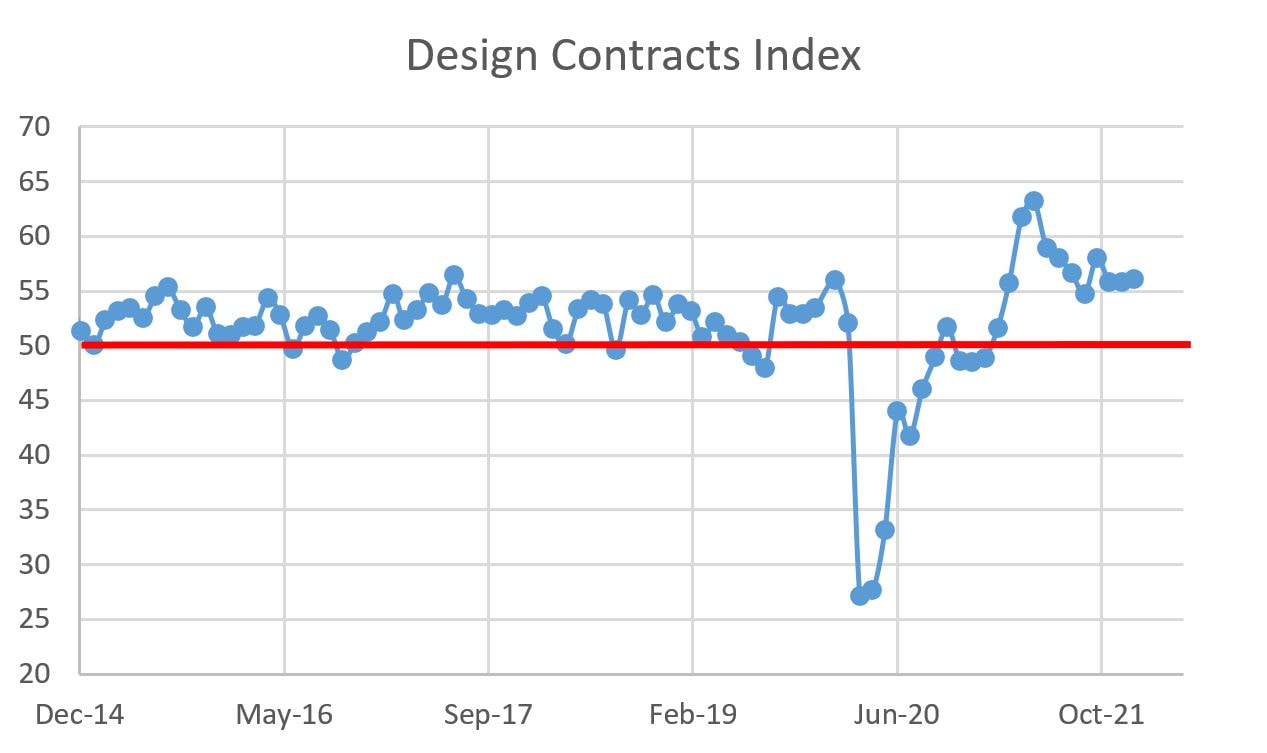
0 Comments
|
Archives
January 2024
Categories |
 RSS Feed