Builder blog

Current events and commentary regarding the construction industry. Opinions are my own.
Justin Reginato, Ph.D.
  • About
  • Builder Blog
  • Tacos & Tower Cranes
  • In the News
  • For CM Students

Architecture Billings Are a Mixed Bag, But At Least They Are Performing Better Than the Stock Market

9/26/2022

0 Comments

 
It has been two months since I have posted regarding the American Institute of Architects' (AIA) Architectural Billings Index (ABI). In that two months, the Dow and S&P 500 are down over 9% and the NASDAQ is down over 6%, with the bulk of these drops in the form of market convulsions based on the Fed raising interest rates. Layer this on top of 40-year high inflation and the sundry labor and supply chain issues and you have a cocktail for malaise. However, over that same period of time, the ABI is actually up, albeit by less than 1%. The August ABI registered at 53.3, versus 51 in July and 53.2 in June. But up is up, so keep that in mind before the other shoe drops. Recall that measures above 50 mean billings are increasing, while those below 50 connotate a decline in billings. The ABI is a nine-to-twelve-month leading indicator of commercial building construction activity.

As for that other shoe...there is a lot of negative numbers, both from month-over-month ABI data and year-over-year. The details are as follows, but first a few notes:
  • The month-over-month increase in the overall ABI from 51 in June to 53.2 in August was exclusively the work of the Northeast (+2.9%) and Institutional buildings (+4.8%).  Every other subsector was down.
  • Speaking of the Northeast, that region is very Jekyll and Hyde. Its 10+ year average subsector ABI is 48.4, the only subsector below 50. That said, it is home to three of the top 10 metro areas for construction starts (New York, Washington, D.C. and Philadelphia). I am aware there is a pretty big difference between starts for the first half of this year and 10+ years of data, but I still find it interesting that the lagging region houses some of the busiest cities.
  • Between the overall ABI, the regional and building type subsectors, Project Inquiries and Design Contracts (11 total data sets), five are now below their 10+ year averages:
    • West: 50.2 in August versus a 128-month average of 50.7
    • Multi-family Residential: 52 in August versus a 128-month average of 52.3
    • Institutional: 52 in August versus a 128-month average of 50.2
    • Project Inquiries: 57.9 in August versus a 128-month average of 59.1
    • Design Contract Index: 52.3 in August versus a 128-month average of 52.4
  • The overall August ABI of 53.3 is greater than the 128-month average of 51, so not all is bad.

Per usual, it will be important to watch the ABI and other metrics (e.g. construction material costs and labor rates) as the economy continues to navigate choppy waters. I suspect the measures will decline more next month given the sense of pessimism on Wall Street, but I hope I am wrong. There is a bit of distance between Wall Street and market demand. 
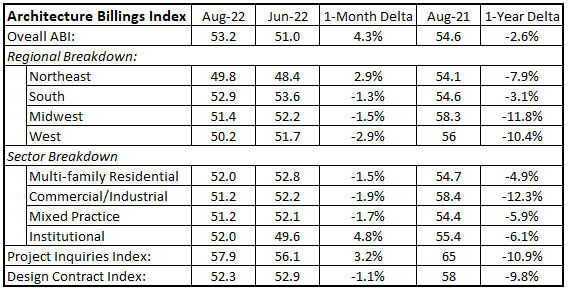
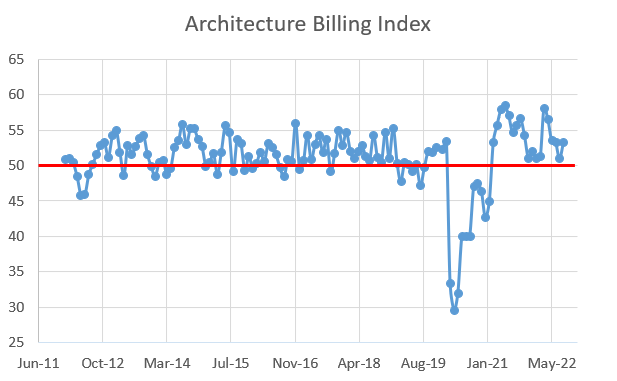
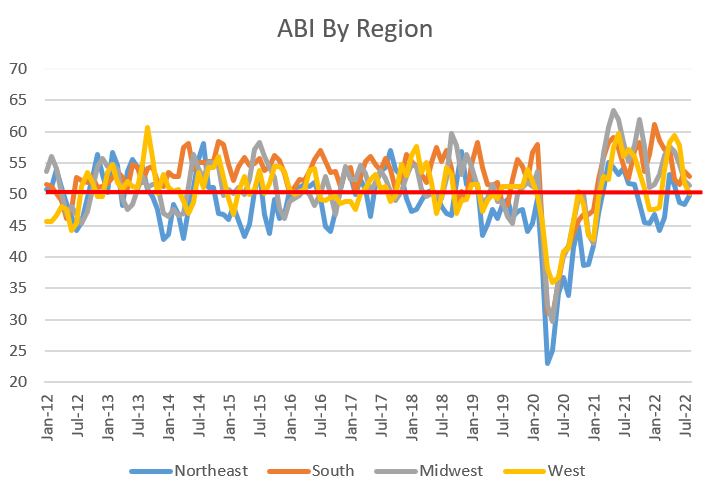
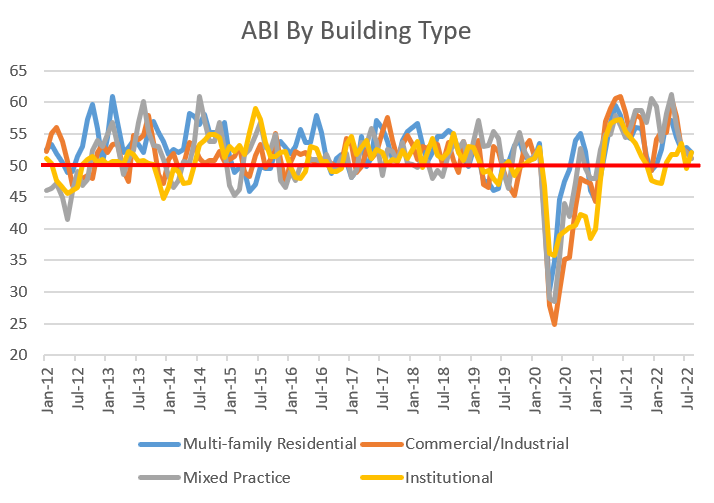
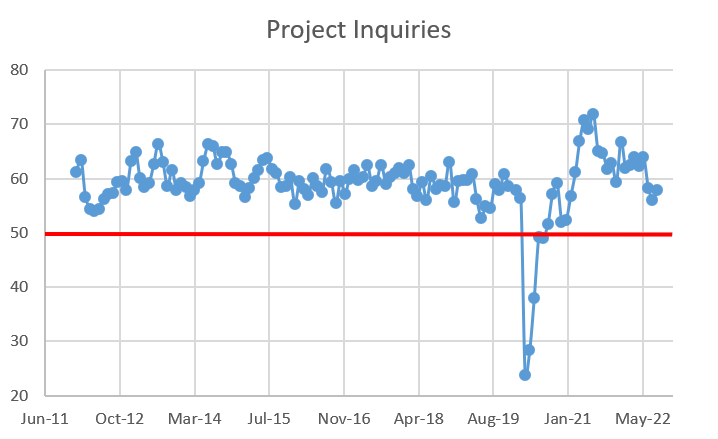
Picture
Picture
Picture
Picture
Picture
Picture
0 Comments

    Archives

    November 2022
    October 2022
    September 2022
    July 2022
    June 2022
    May 2022
    April 2022
    March 2022
    February 2022
    December 2021
    November 2021
    October 2021
    September 2021
    August 2021
    July 2021
    June 2021
    May 2021
    April 2021
    March 2021
    January 2021
    December 2020
    November 2020
    October 2020
    September 2020
    August 2020
    July 2020
    June 2020
    May 2020
    April 2020
    September 2019
    August 2019
    September 2018
    June 2018
    April 2018
    March 2018
    February 2018
    January 2018
    March 2016
    February 2016
    January 2016
    November 2015
    February 2015
    December 2014
    November 2014
    September 2014
    August 2014
    July 2014
    June 2014
    May 2014
    April 2014
    March 2014
    February 2014
    January 2014
    December 2013
    November 2013
    October 2013
    July 2013
    April 2013
    March 2013
    February 2013
    January 2013
    December 2012
    November 2012
    July 2012
    May 2012
    April 2012
    February 2012

    Categories

    All
    Economics
    Real Estate
    Technology

    RSS Feed

Powered by Create your own unique website with customizable templates.
  • About
  • Builder Blog
  • Tacos & Tower Cranes
  • In the News
  • For CM Students