|
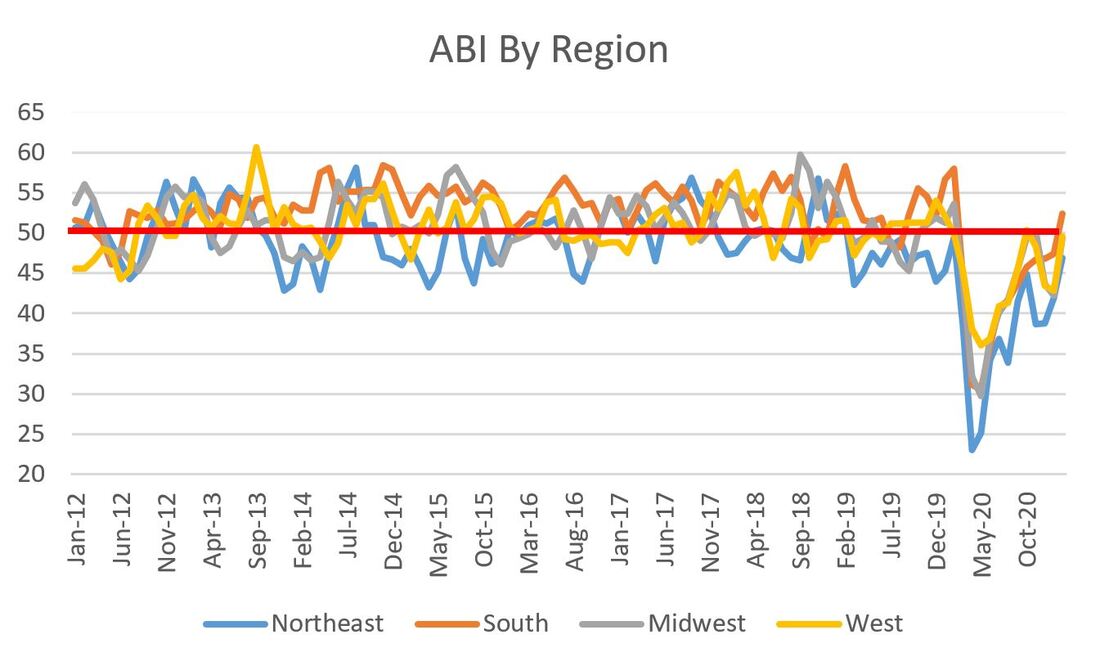
Back in black I hit the sack I've been too long, I'm glad to be back Yes, I'm let loose From the noose That's kept me hanging about I've been looking at the sky 'Cause it's gettin' me high Forget the hearse 'cause I never die I got nine lives Cat's eyes Abusin' every one of them and running wild -AC/DC "Back in Black" Thanks for tolerating my trip back to high school head banging. Speaking of peaking, the American Institute of Architects' Architecture Billings Index (ABI) is back to where it was in February 2020 and has surged into positive territory, clocking a 53.3 for February 2021. A value greater than 50 means that architecture billings are increasing; conversely, any value less than 50 means billings are decreasing. The ABI is a leading indicator of commercial building construction by approximately nine to 12 months. Whew...we needed this little ray of sunshine. 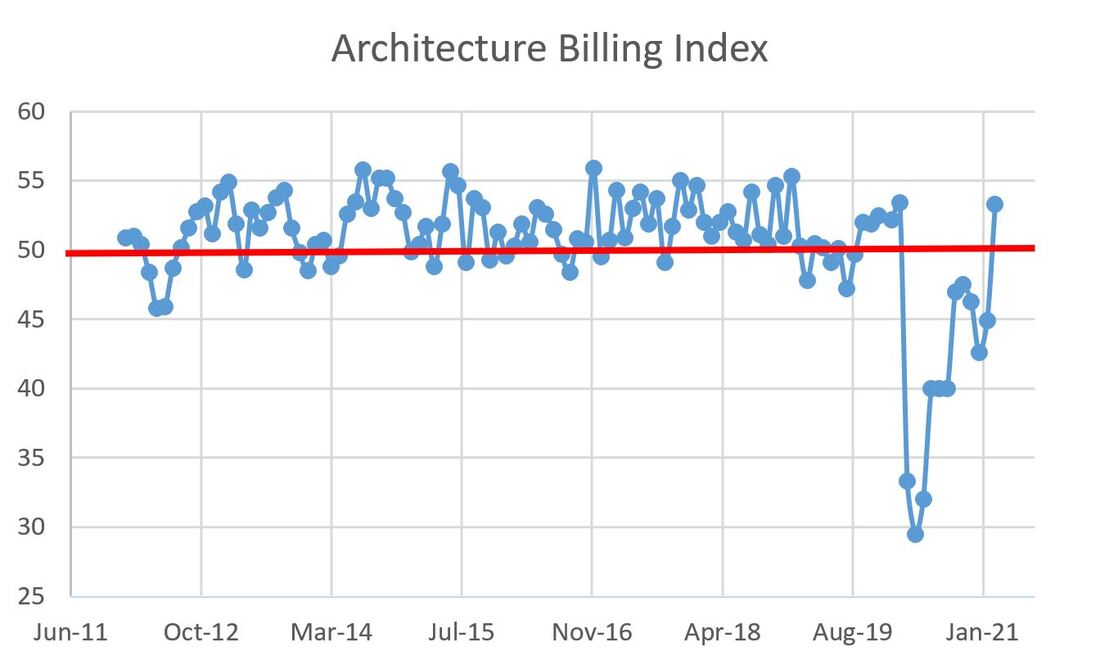 To be clear, we are not totally our of the woods as there are still areas of weakness (sub 50 results), as evidenced by the regional data:
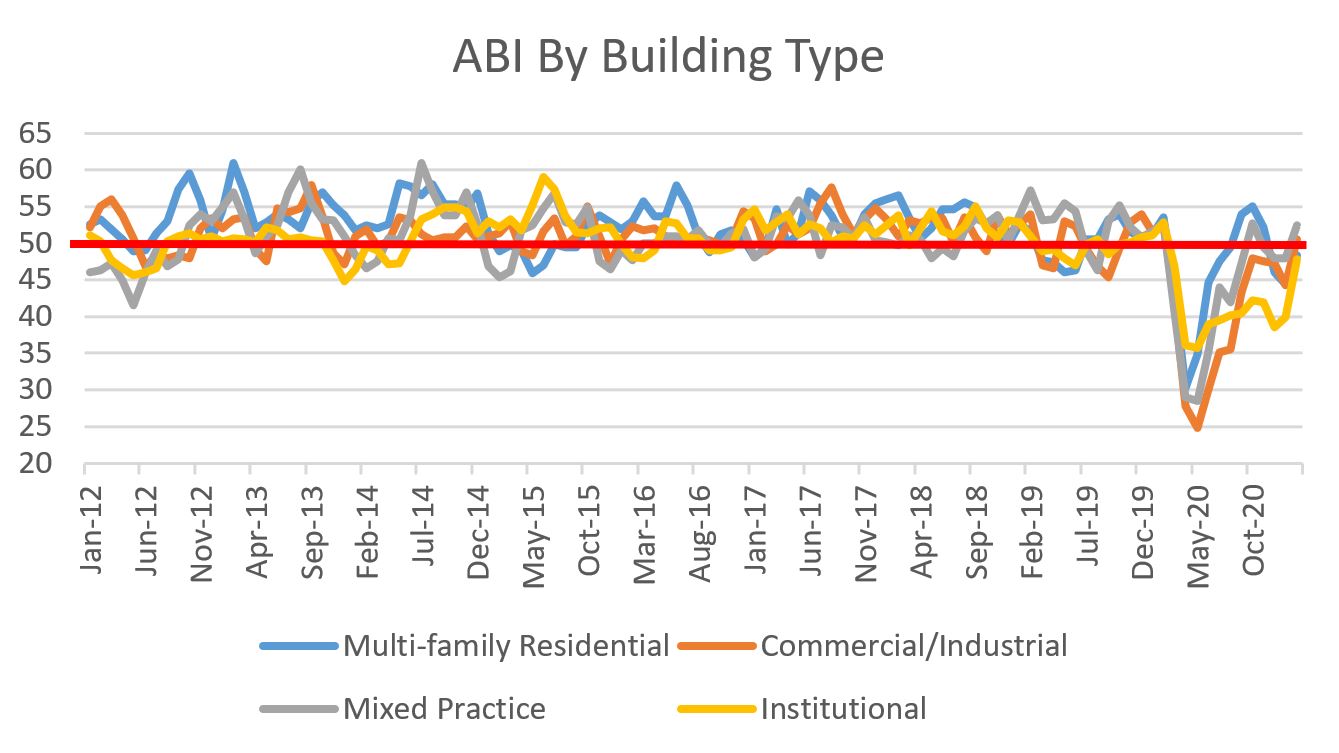
 For the industry sector breakdown, the balance between advancers and decliners was split 50/50:
 Project inquiries have been above 50 since August, but they pierced the 60 level in February. 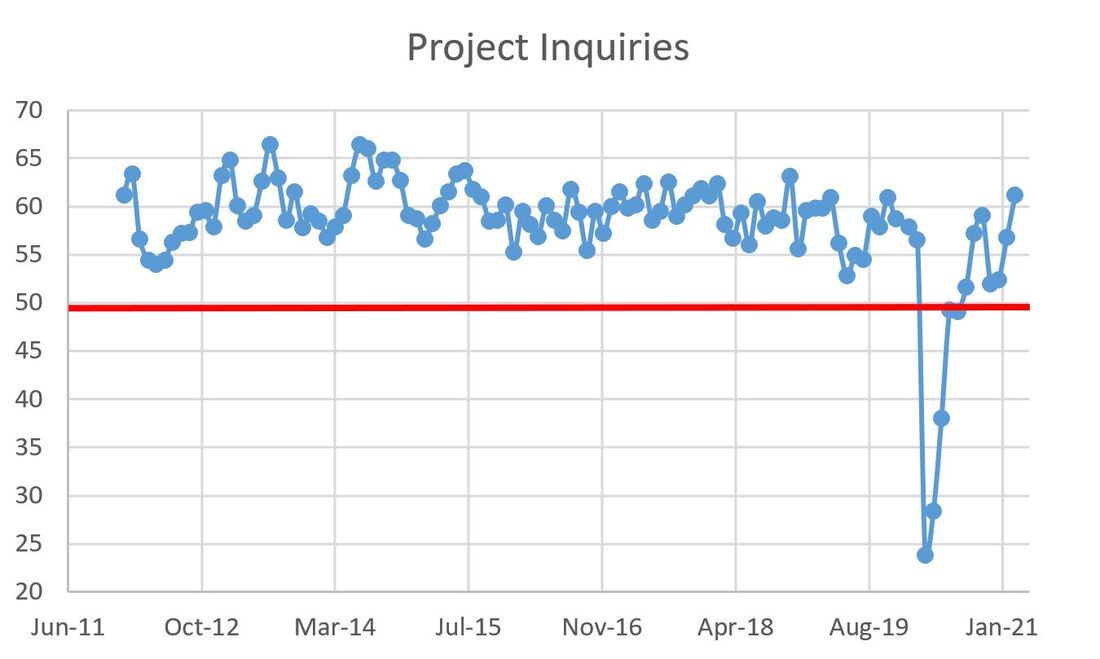 All in all, pretty good news from the billings front, likely supported by larger positive macro trends (vaccination roll out, stimulus, Federal Reserve holding steady, and on and on...). It is nice to finally have some good news. That said, the construction industry still has some headwinds to watch (commodity prices and labor constraints to name but two). Let's worry about that next week. For now, let's just enjoy this month's ABI.
0 Comments
That title is a Jedi mind trick...yes, the American Institute of Architects' Architecture Billings Index (ABI) did slow its declines from last month, but they are still declining. The January 2021 ABI figure came in last week at 44.9, up from 42.3 in December. Bigger is better, however values less than 50 mean that billings are decreasing. The last time the ABA was above 50, meaning they were increasing, was February of last year (you know, before COVID put the United States into a state of chaos). Next month ought to be interesting. The ABI serves as an approximately nine to 12-month leading indicator for commercial building construction activity. 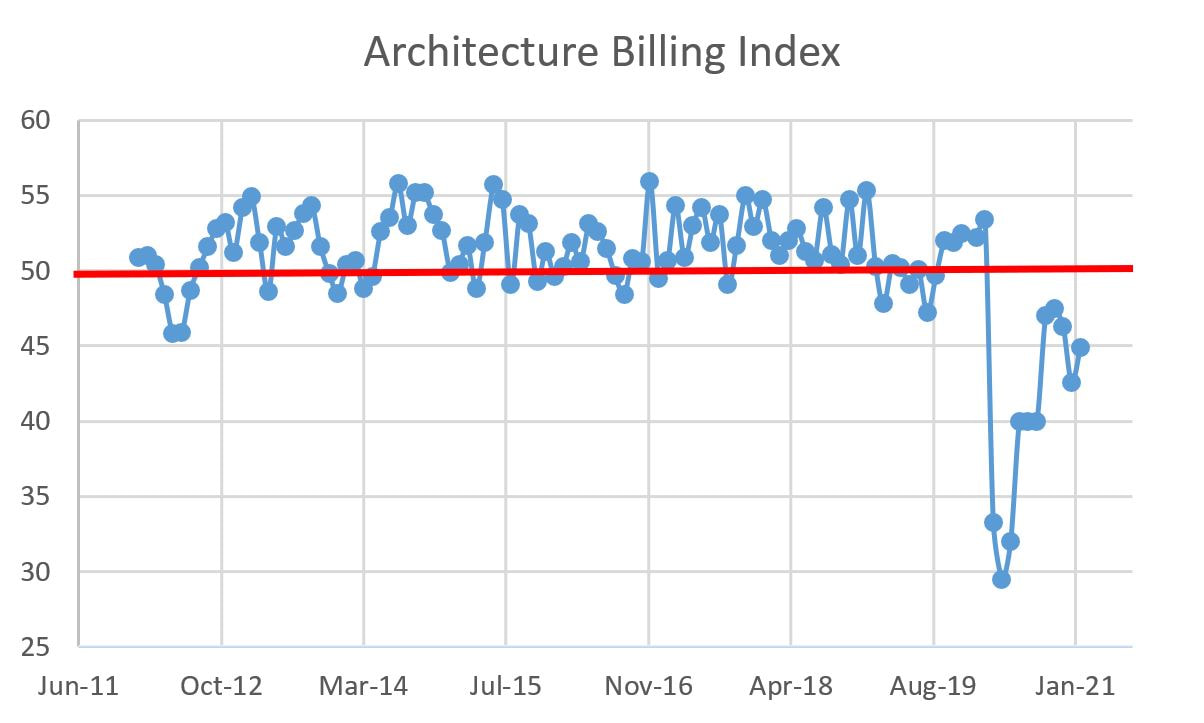 The ABI is way off its lows of April 2020, where it logged a dismal 29.5, yet there was another more modest decline in the last two months of 2020. This recent figure shows a positive reversal in that trend. That same post-cratering dip shows up in the project inquiries graph, but it too reversed in January 2021. 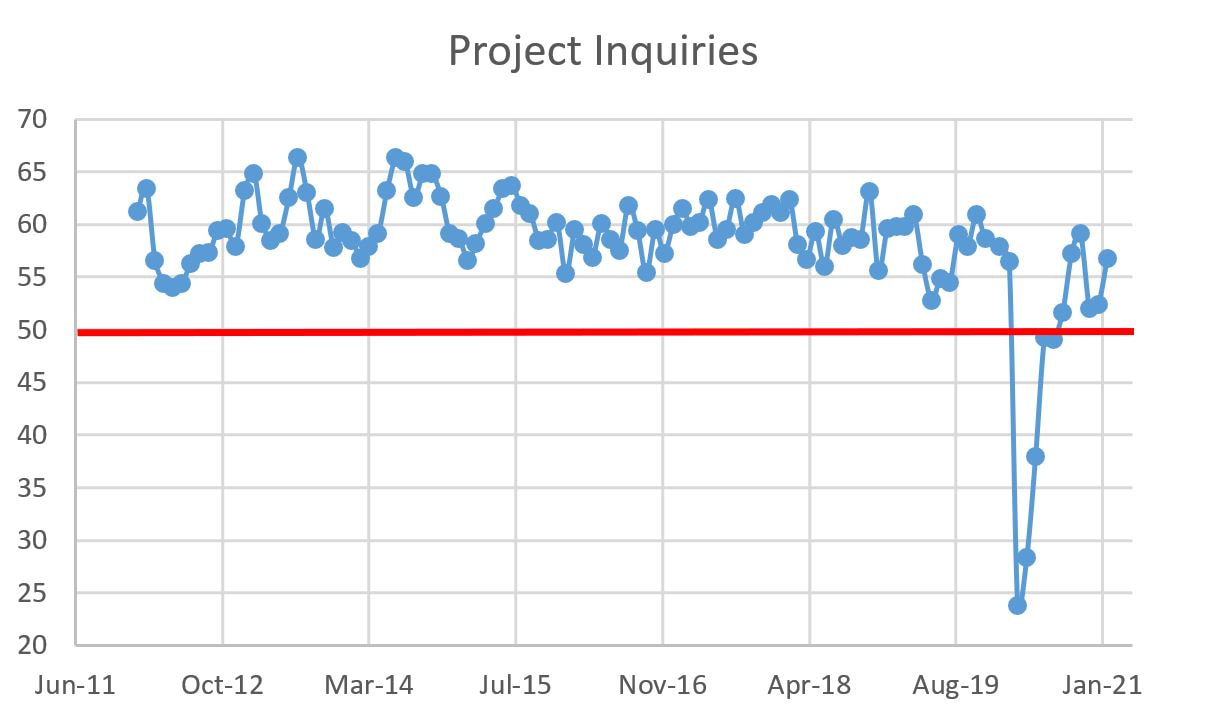 The specific data is a collection of mixed bag results with some up from last month and others down. For the regional data, there are two advancers and two decliners. Unfortunately, I live in one of the decliners.
 For the industry sector breakdown, the decliners outnumbered the advancers 3 to 1:
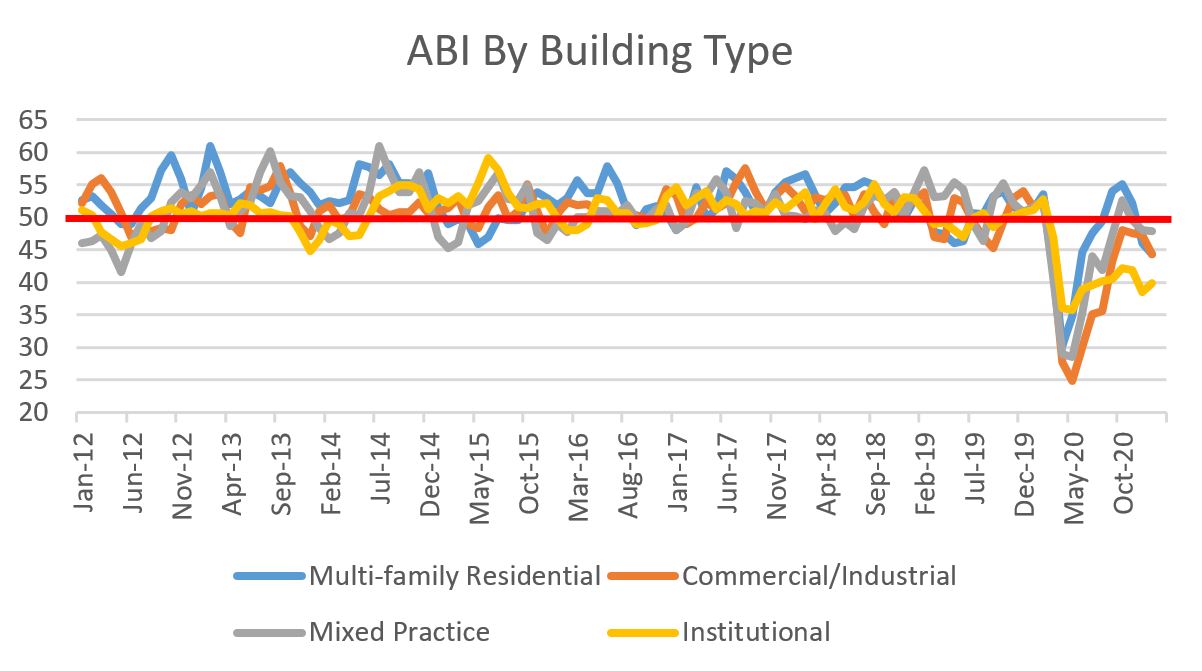 While institutional projects did not plumb the same depths as the three other sectors, it is clearly the laggard as the market corrects. The fits-and-starts of the ABI (and its subcategories) also loosely follows the Chicago Board of Options Exchange volatility index for stocks (VIX) which may suggest that billings are trending with greater economic sentiment (a theory I am wholly unable to prove/disprove but does make me wonder). Where as stock traders like volatility and the corresponding price changes, I am guessing most of us in the AEC world would prefer some stability. Hopefully the wild fluctuations are subsiding. Tune in next month for the one-year anniversary of the ABI's 38% drop to see how we have recovered since then.
|
Archives
January 2024
Categories |
 RSS Feed