|
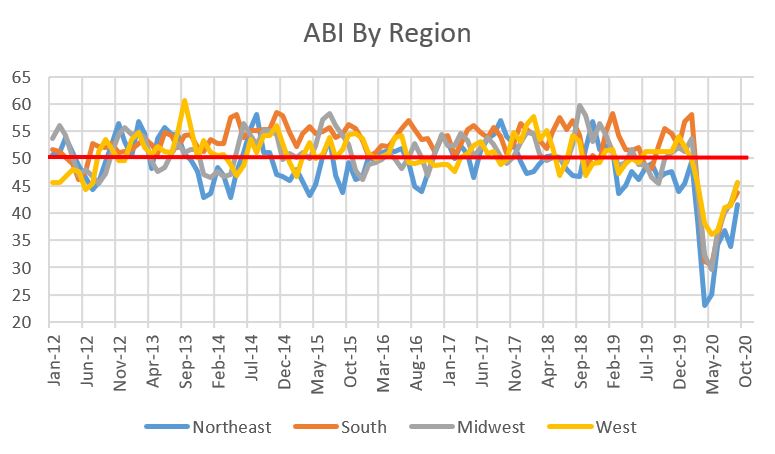
The whipsawing in the construction industry continues. Last month the good news/bad news was slow architectural billings but increased contractor backlogs. This month is just the opposite. So very 2020. Per usual, let's start with the American Institute of Architect's Architectural Billings Index (ABI). Per the usual refresher, the ABI is a leading indicator of commercial building construction by approximately nine to 12 months. A value greater than 50 means that architecture billings are increasing; any value less than 50 means billings are decreasing. In September the ABI increased sharply from 40 to 47 (yay!) but is still less than 50 so billings are still decreasing (boo!). The trend is definitely positive and the rebound off of April's bottom does not appear to a false narrative. Project inquiries are on a two month streak above 50 with September clocking in at 57.2. Inquiries represent interest in projects but not the actual start, but the sharp increases since April are a positive sign. Project inquiries are on a two month streak above 50 with September clocking in at 57.2. Inquiries represent interest in projects but not the actual start, but the sharp increases since April are a positive sign. 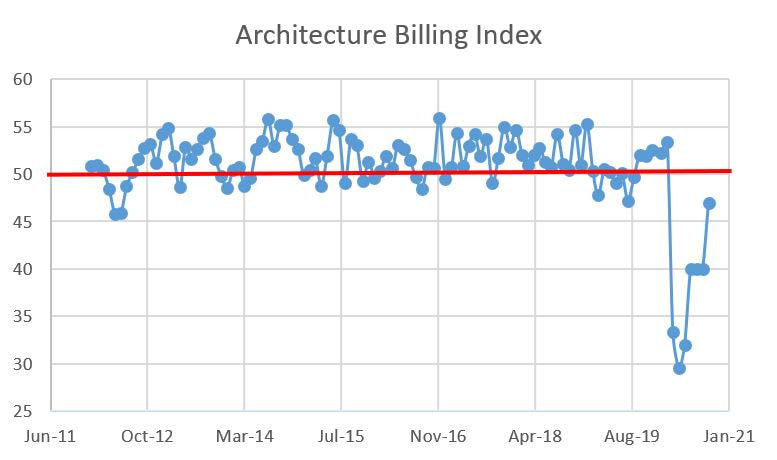 Project inquiries are on a two month streak above 50 with September clocking in at 57.2. Inquiries represent interest in projects but not the actual start, but the sharp increases since April are a positive sign. 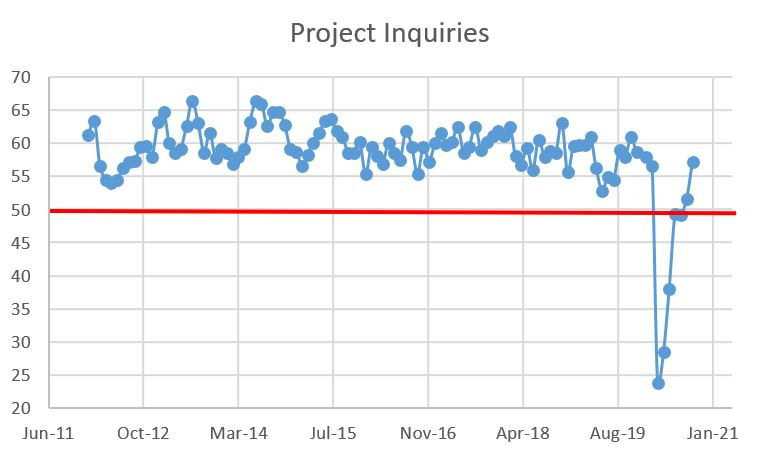 While none pierce the 50 level, the regional data shows nice increases from last month. It is a little odd to see the South in third place given its torrid growth over the past few years. The breakdown for each region is as follows:
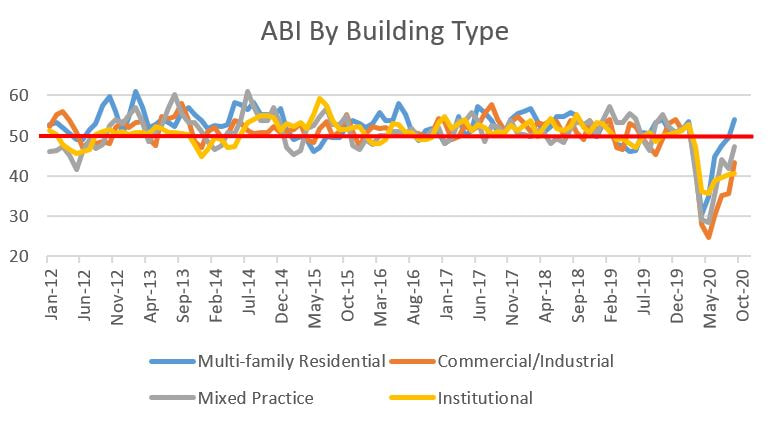
 By building type, multi-family breached the 50 level and continues to lead all other sectors. The September stats for all are:
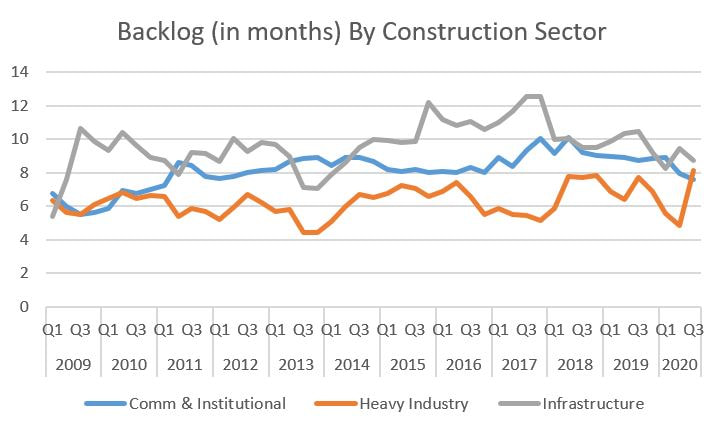
 Now let's look at contractor backlogs as reported by the Associated Builders and Contractors. After an increase in August, September saw decreases. The graphs below represent quarterly data through Q3 2020 so the trends continue to look negative. Contractors now have an overall backlog of 7.5 months in September, down from 8 months in August. 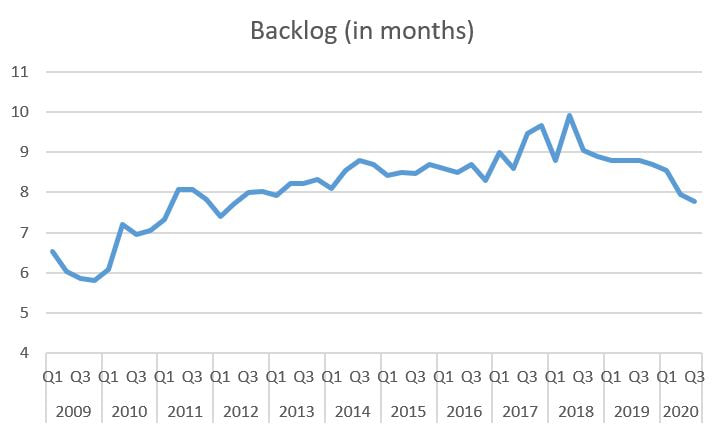 The details continue to be choppy. Let's start with the details by industry sector for September:
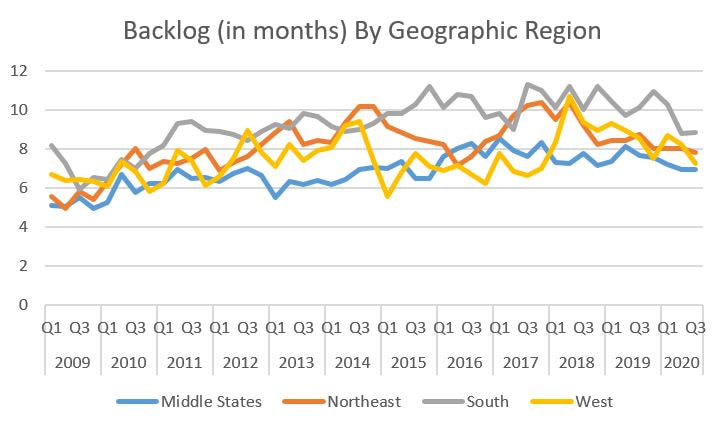
 Interestingly, while I previously mentioned it is odd to see ABI for the South in third place, the backlog for the South was the only gainer this month. The details are as such:
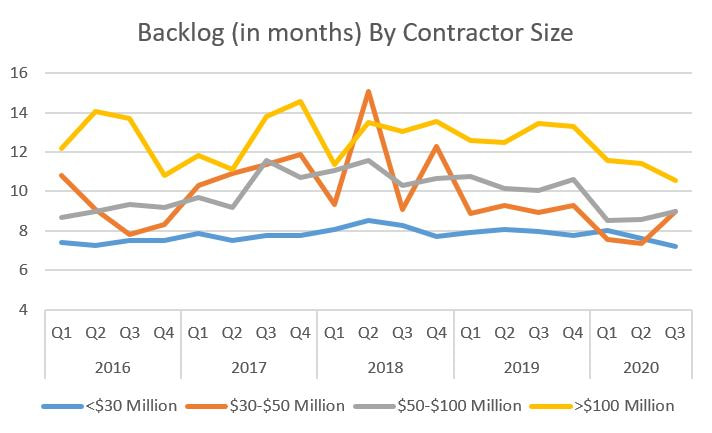
 The closing data are backlog by contractor size. The month-to-month data decreased with one exception:
 2020 is such a different environment that 2019 but the construction industry has stabilized after some sharp economic declines earlier this year. Given the continued drama around COVID and the upcoming presidential election, hopefully the industry holds steady with two small steps forward for every one small step backwards.
0 Comments
|
Archives
January 2024
Categories |
 RSS Feed