|
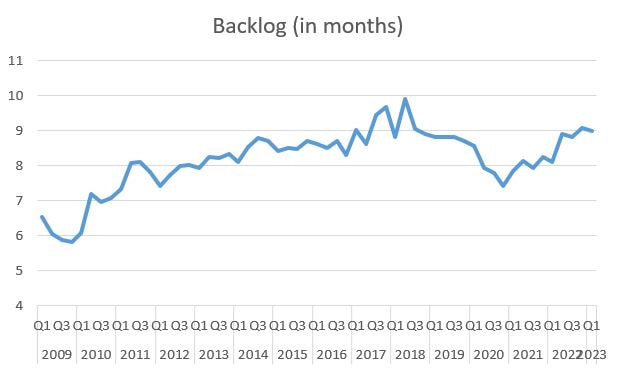
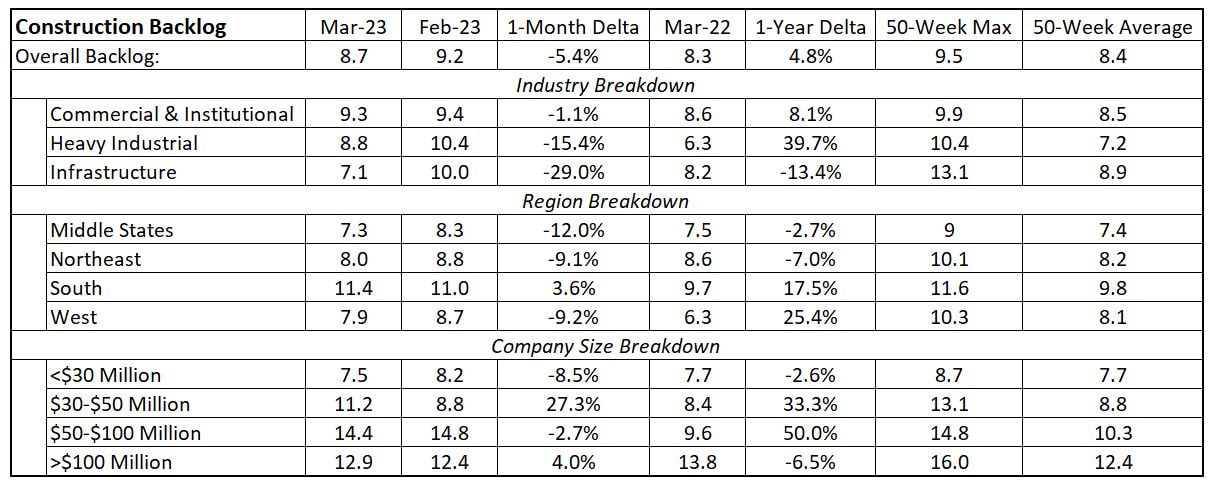
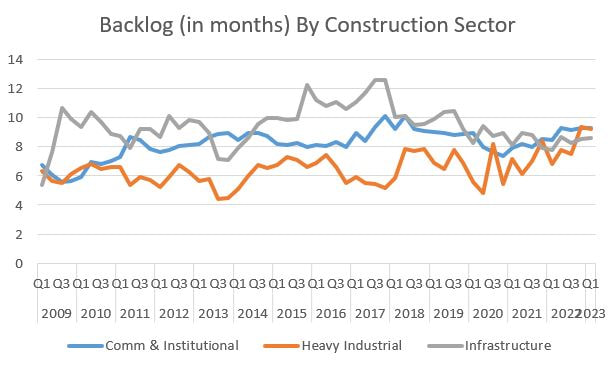
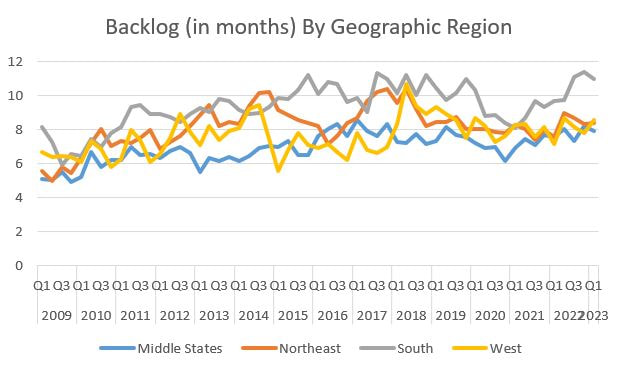
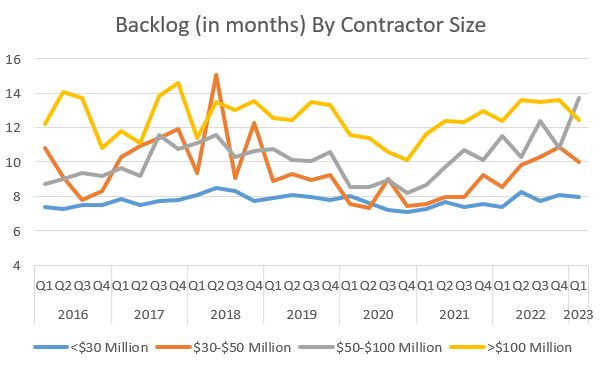
It has been a while since I wrote about contractor backlogs and I picked a lousy month to restart. Backlogs declined across most categories, deeply in some cases. Backlog can be represented two ways. It can be measured in dollars as the amount of future work under contract. Conversely, it can be represented as the duration of time that a contractor will be busy without adding any additional work. In either case, it is a representation of how busy contractors are, and when contractors are busy, it is a sign of a robust market and increased pricing power for contractors. Backlog will be represented below in months, and the overall industry backlog decreased from 9.2 months to 8.7 months. On a quarterly basis, backlog has moved sideways since Q2 2022. Keep in mind that backlogs have been increasing in fits and starts since bottoming out in Q4 2020 due to the COVID-19 pandemic. Digging into the detailed data shows widespread drops in backlog. As with most economic data, there are some pockets of good news. First the good news: the South remains a hot region for construction. Also, and I find this very interesting, backlogs increased for all size categories except small contractors (<$30 million in annual volume). Unfortunately, that's where the good news ends. Backlog for smaller contractors was down sharply, and the news was worse in the all regions except the South. The real pain was saved for the heavy industrial and infrastructure categories.
If we zoom out to the year-over-year data, the picture is a bit better, with eight of 12 categories increasing. But the infrastructure numbers are confounding. Given all the government funding being rotated into infrastructure, I would expect backlogs to be growing. However, it may just be a while before we see infrastructure construction to increase as many projects may still be in design. We will just have to see how that category evolves over the next few years. For more details on how the data has evolved since 2009, keep scrolling.
0 Comments
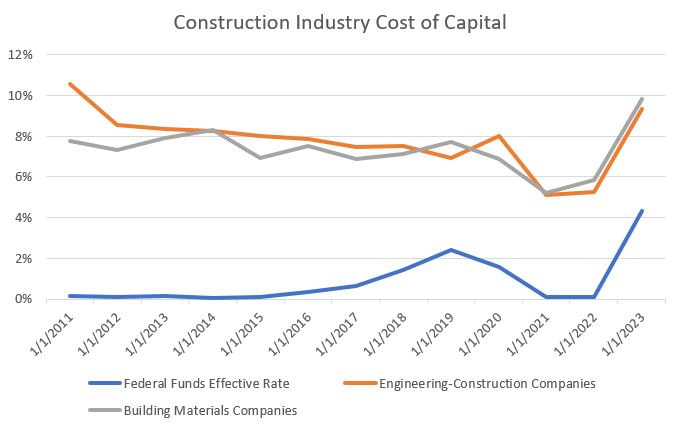
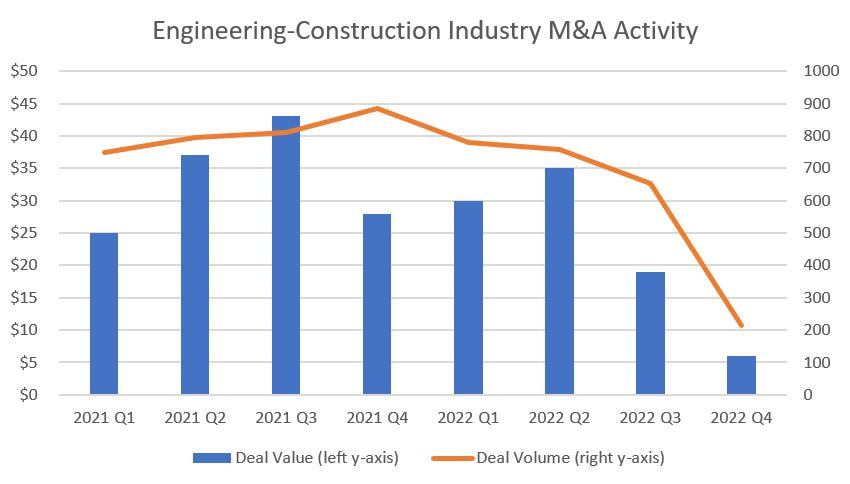
For those of you following the financial press, much of the discussion is about what moves Jay Powell his and his fellow voting board members of the Federal Reserve of the United States will do with the Federal Funds Rate. Simply stated, the Fed Funds Rate is the interest rate that depository institutions, such as banks and credit unions, lend their reserve balances to other depository institutions. The Federal Reserve is currently increasing the Fed Rate in an effort to make it more expensive to borrow money, and hence, more costly to finance goods (both personal and business). The Fed is doing this to purposefully cool the economy to tame inflation. The construction industry is highly dependent on credit. (In the simplest terms that deserve their own post, most construction companies need to borrow money to complete projects due to cash flow challenges created by the mismatch between project expenditures and progress payments received. Also, the construction industry is equipment dependent, much of which is financed.) So if the Fed is increasing the Fed Rate, and by association the cost of borrowing, what is happening to the cost of capital for players in the construction industry? Does the construction industry cost of capital increase similarly as the Fed Rate? The answer is yes. Before revealing the data, some background. The cost of capital being used is the weighted cost of capital (WACC) based on a company's blend capital sources, chiefly common stock equity, preferred stock equity and bonds. Equity is most often associated with public companies and the data represented is for publicly-traded companies (as provided by Prof. Aswath Damodaran of the NYU Stern School of Business). The overwhelming majority of construction companies are not publicly-traded. Most are privately-owned small businesses, so that is a weakness of the data below in terms of applying it to the entire construction industry. But publicly-traded companies must report their finances, so that is the available data. All that being stated, below are the WACC for engineering-construction companies and building materials companies compared to the Fed Rate. The Fed Rate was effectively zero for an entire year (2021 to 2022) and then increased sharply to 4.33% in January 2023. It is currently 4.75% and was predicted to go higher at the next Fed board meeting until Silicon Valley Bank went sideways (due in part to its inability to manage the increasing Fed Rate unlike every other bank save one, Signature Bank in New York, which also recently failed). The WACC were 5.1% and 5.2% for engineering-construction companies and building material suppliers, respectively, in January 2021. The both moved sharply upwards, in lock step with the Fed Rate to 9.34% for engineering-construction and 9.82% for materials in January 2023. So what does this mean? Aside from a higher WACC cooling the economy (higher WACC means a higher cost of construction), there are other knock-on effects. In recent years, many large construction companies have been engaging in mergers and acquisitions. M&A takes many forms in the construction industry, from one firm buying another or a division of another (e.g. Pearce Renewables buying Mortenson Renewables), specialty contractors buying companies to broaden scope (e.g. an electrical contractor buying a mechanical contracting company to become a "super sub"), a general contractor forward integrating by purchasing or investing in a self-perform division (a GC buying a company or the equipment to self-perform concrete) or a contractor backwards-integrating into the supply chain to buy a material provider (a company that self-performs framing buying or investing in a company that provides cross-laminated timber). In order to make these types of company (or division) acquisitions or investments in new lines of business takes capital. The more expensive the WACC is, the harder it is to finance acquisitions. And the increasing cost of capital for engineering-construction and building supply companies is correlated with reduced M&A transactions, both in number and in aggregate value (data from Refinitiv). Correlation is not causation, but it is tough to ignore the connection between increasing WACC and reduced M&A activity. These trends are consistent across other industries as well.
I suspect we will see less expansion of companies (opening additional offices in new geographic locations), contractors focusing deeper on their true strengths rather than diversifying into adjacent business lines, and focusing on supplies or installation but less of doing both. As the economy contracts, builders will stick to what they do best to maintain their highest profit potential. |
Archives
January 2024
Categories |
 RSS Feed