|
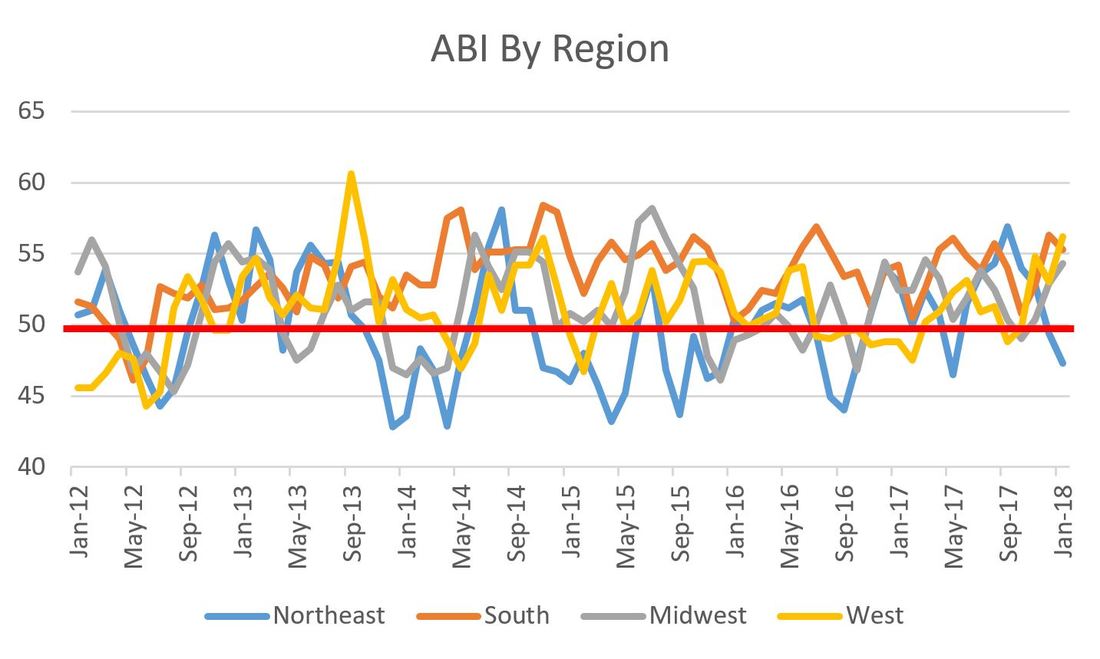
The most recent ABI data just dropped, but first an update on material prices. Materials for non-residential construction are up 4.7% year-over-year. Softwood lumber is up 14.5% which was discussed a couple of weeks ago. Crude oil was the largest gainer at 30.3% y-o-y, meaning the cost of gasoline and diesel is climbing. 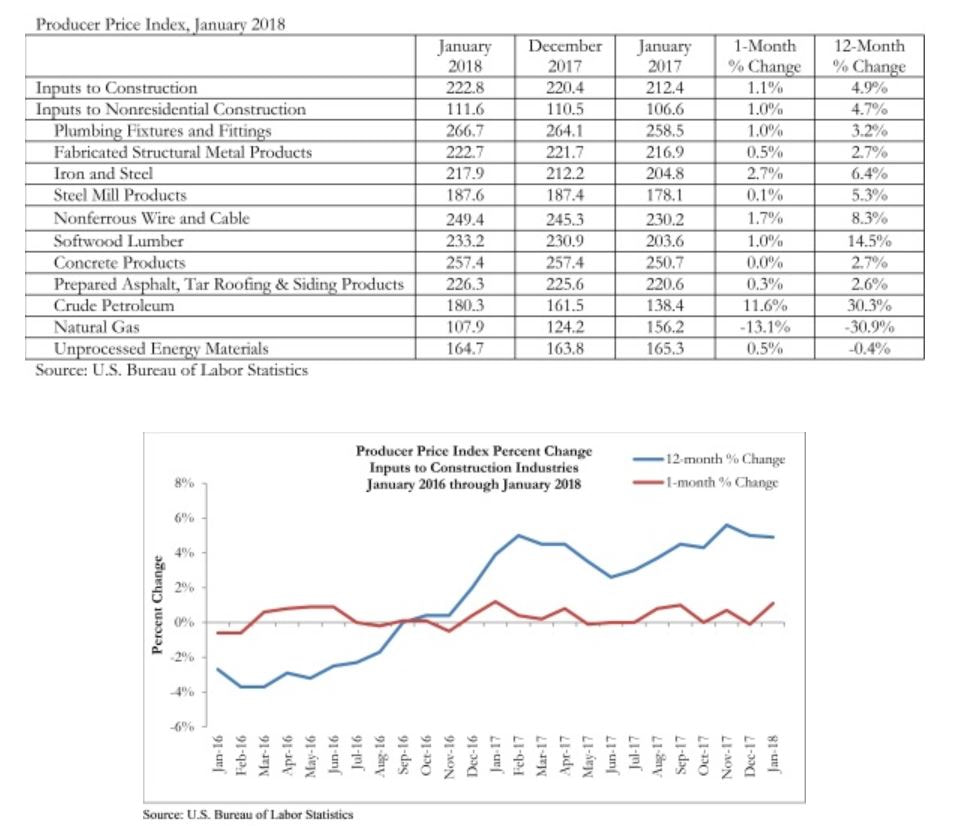 OK, let's move on to my favorite leading indication: ABI. Per my usual explanation, the ABI records architectural billings on commercial building projects. Any value greater than 50 means that architecture billings are increasing; conversely, any value less than 50 means billings are decreasing. The ABI is a leading indicator of commercial building construction by approximately nine to 12 months. For January, the ABI came in at 54.7, a sharp up-tick from the previous month's adjusted 52.8 figure. 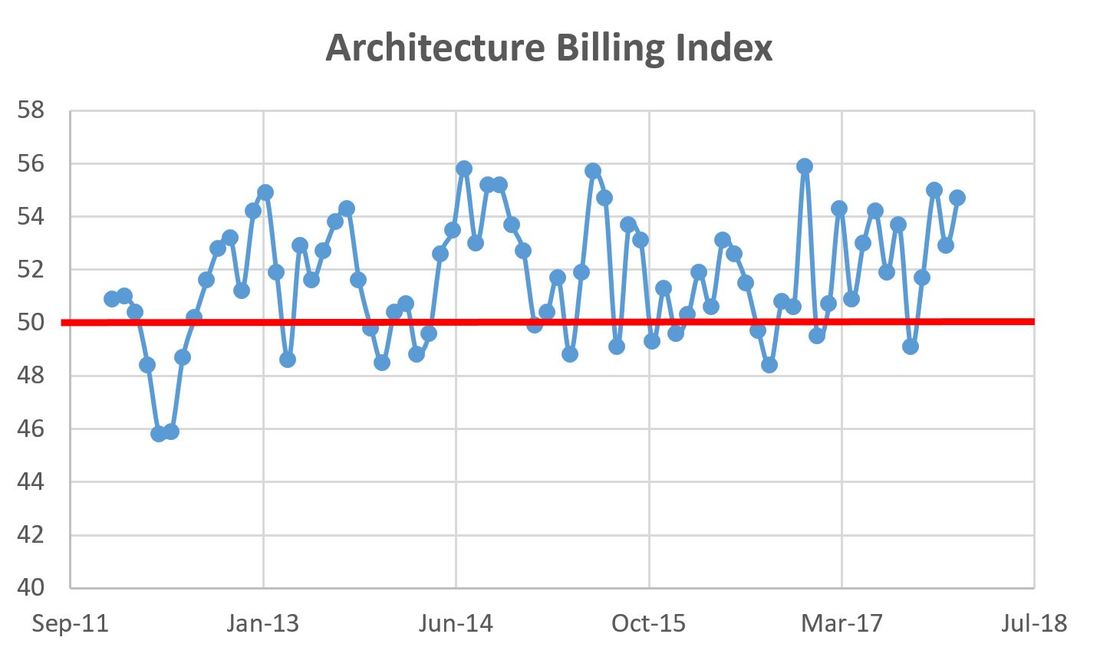 The regional breakdown for January 2018 goes like this:
 Looking at the ABI figures by building type, we have the following:
0 Comments
Two days ago, I posted about how the AIA is predicting a growth of 4% in the non-residential market. Dodge Data & Analytics tempered that good news just a bit today by stating commercial and multifamily construction starts in 2017 totaled $195 billion, down 7% from the previous year. However, 2017 was up 8% than 2015. Of interest, seven of the top 10 metro areas Dodge tracks saw double-digit declines in starts (Boston -26%, Chicago -26%, DC -16%, DFW -17%, LA -20%, Miami -20% and NYC -16%). The multi-family sector, which has been on a multi-year tear, is particularly poised for a slow down according to Dodge Chief Economist Robert Murray due to tighter lending criteria in the banking industry and a slight uptick in vacancy rates (which are still near historic lows). The large metro areas have seen torrid growth which is encouraging developers to seek projects is other (read: less expensive) markets. Combine that with the current version of the Trump administration infrastructure plan, which while surrounded by question marks, calls for 25% of the funds to be allocated outside of large metro areas, means that the market is shifting geographically yet remains promising.
American Institute of Architects' is predicting a growth in non-residential construction of 4% in 2018 and 3.9% in 2019, demonstrating likely sustained strength in the construction market. With the exception of religious facilities, all sectors of the non-residential market are predicted to see growth in 2018. 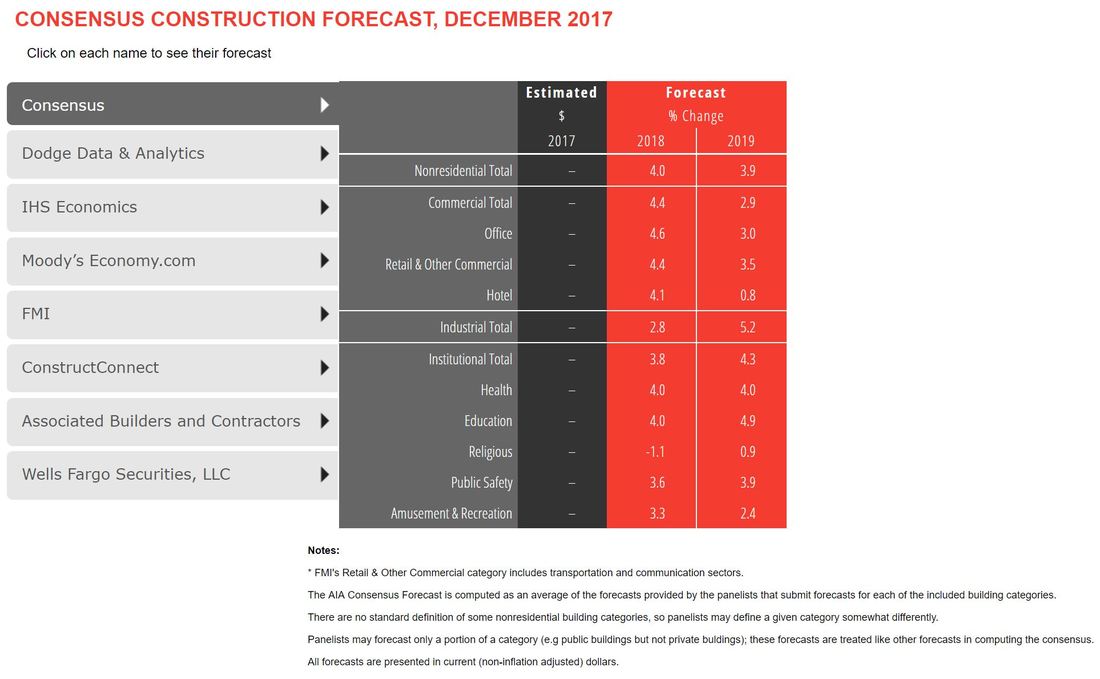 According to AIA Chief Economist Kermit Baker, the growth is fueled by the rebuilding from last year's natural disasters, the recently enacted tax bill and the anticipation of an infrastructure bill. The growth prediction is supported by the AIA's Architectural Billings Index, which is a leading indicator of construction growth.
Yesterday was a big day for construction economic news. First, the U.S. Census Bureau reported that construction spending increased 0.7% in December, from an adjusted $1.23 trillion figure in November to $1.24 trillion in December 2017. On a year-over-year basis, 2017 saw a 3.8% increase in construction spending. While this was the smallest percentage increase in six years, it is still a healthy number. The strong construction market is due to many reasons, among them a strong employment market, low interest rates and post-natural disaster (floods, fires) reconstruction. Building on the strong employment market, the construction industry, according to the U.S. Bureau of labor Statistics, added net 36,000 new jobs in January 2018. This figure is included in the 226,000 new jobs added over the past 12 months. 3,600 of the new jobs created in January were in the heavy-civil sector which, according to Associated Builders and Contractors (ABC) Chief Economist Anirban Basu, could be an early signal of public infrastructure spending. Lastly, Bill McBride at the Calculated risk blog reports that framing lumber prices are up significantly over the past year. Random Lengths lumber costs are up 31% from a year ago, while CME (Chicago Mercantile Exchange) futures are up 39% year-over-year. The prices are now higher than the housing bubble prices of 2010 and another bubble price in 2013. 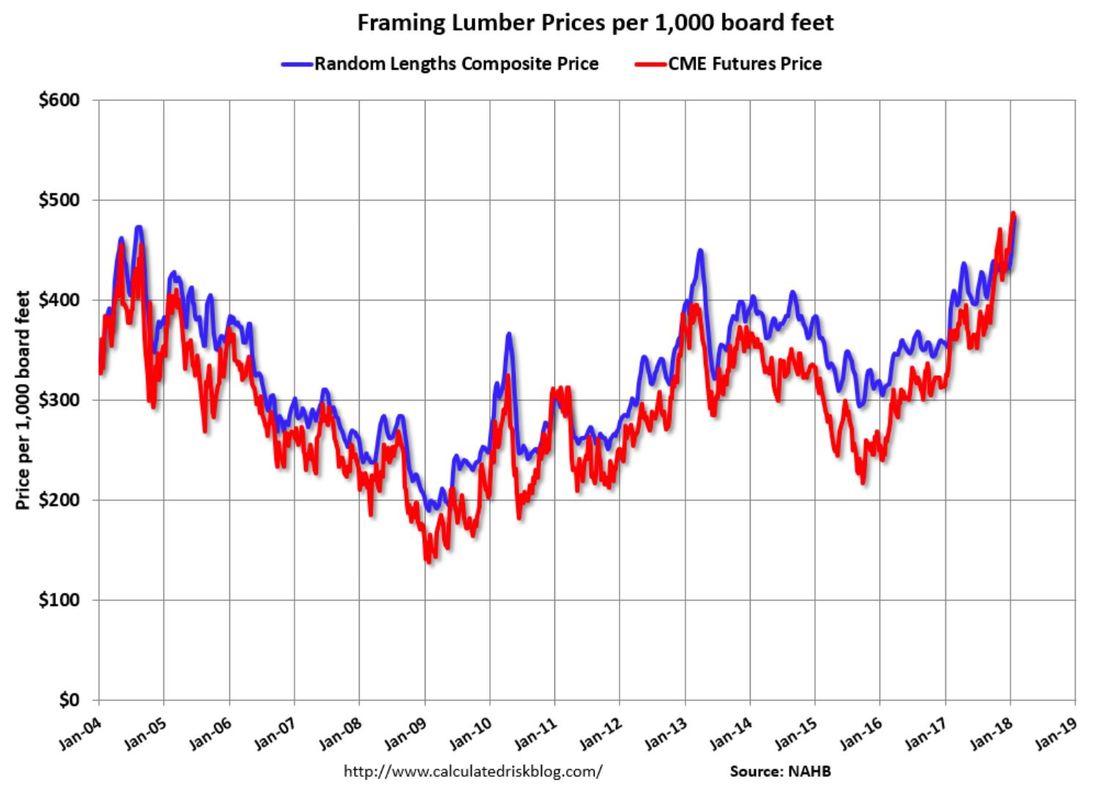 |
Archives
January 2024
Categories |
 RSS Feed