Builder blog

Current events and commentary regarding the construction industry. Opinions are my own.
Justin Reginato, Ph.D.
  • About
  • Builder Blog
  • Tacos & Tower Cranes
  • In the News
  • For CM Students

Architectural Billings Crater

4/23/2020

0 Comments

 
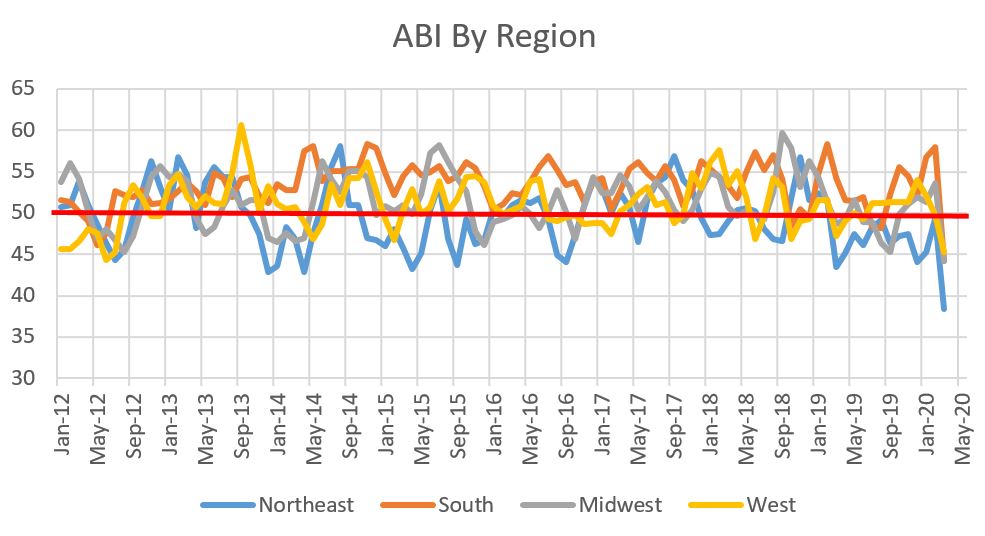
I just read my last post from September about how the AIA Architecture Billing Index (ABI) tumbled. How cute was that? The score dropped from 50.1 in July to 47.2 in August and remained below 50 by settling in at 49.7 in September. (For background, any value greater than 50 means that architecture billings are increasing; conversely, any value less than 50 means billings are decreasing. The ABI is a leading indicator of commercial building construction by approximately nine to 12 months.) The scores zoomed back above 50, peaking at 53.4 for February. Wow, that was crazy!

Well, it seemed crazy until this month. Before continuing, you may want to pour yourself a stiff drink.

The ABI for March fell 20.1 points to 33.3. This is the largest drop in the index's 25 year history.  For reference, the largest previous drops during the 2001 and 2008-2009 recessions were 9.4 and 8.3 respectively. 
Picture
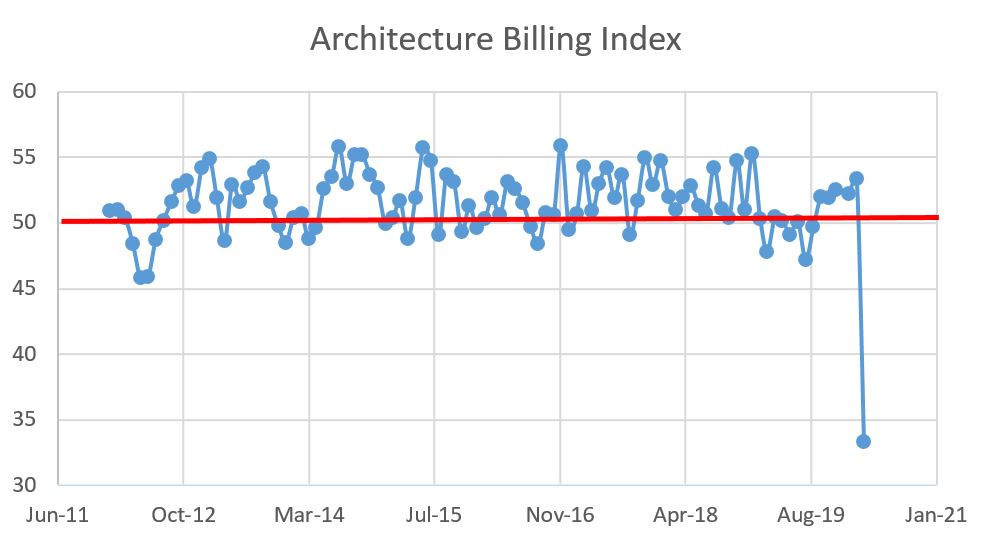
The regional breakdown for March 2020:
  • West: 45.3 (the best of the bunch, for whatever that's worth; down from February's 49.8)
  • Northeast: 38.4 (down from 49.4 in February)
  • South: 44.2 (down from last month's phenomenal 58)
  • Midwest: 44.2 (Down from a very respectable 53.6)
Picture
The Sector Averages for February 2020 are as follows:
  • Multi-family Residential: 43.3 (down from 553.5)
  • Commercial/Industrial: 41.9 (down from 52.4 in February, halting a nice four month 50+ streak)
  • Mixed Practice: 40.6 (the worst performing sector, down from 52.7 in February)
  • Institutional: 46.9 (down from last month's 52.8)
For good measure, the Project Inquiries value in March came in at 23.8 after averaging 575. over the previous 12 months. Likewise, the Design Contract Index for February was 27.1, deviating strongly downward from an average of 51.9 over the previous 12 months.

​The need for buildings, especially housing, didn't just dry up overnight. However, given the overall health of the economy and the deep uncertainty as to the depths of the COVID-19 fallout, it will take several months for these bruises to heal, if not much longer.
0 Comments

    Archives

    November 2022
    October 2022
    September 2022
    July 2022
    June 2022
    May 2022
    April 2022
    March 2022
    February 2022
    December 2021
    November 2021
    October 2021
    September 2021
    August 2021
    July 2021
    June 2021
    May 2021
    April 2021
    March 2021
    January 2021
    December 2020
    November 2020
    October 2020
    September 2020
    August 2020
    July 2020
    June 2020
    May 2020
    April 2020
    September 2019
    August 2019
    September 2018
    June 2018
    April 2018
    March 2018
    February 2018
    January 2018
    March 2016
    February 2016
    January 2016
    November 2015
    February 2015
    December 2014
    November 2014
    September 2014
    August 2014
    July 2014
    June 2014
    May 2014
    April 2014
    March 2014
    February 2014
    January 2014
    December 2013
    November 2013
    October 2013
    July 2013
    April 2013
    March 2013
    February 2013
    January 2013
    December 2012
    November 2012
    July 2012
    May 2012
    April 2012
    February 2012

    Categories

    All
    Economics
    Real Estate
    Technology

    RSS Feed

Powered by Create your own unique website with customizable templates.
  • About
  • Builder Blog
  • Tacos & Tower Cranes
  • In the News
  • For CM Students