Builder blog

Current events and commentary regarding the construction industry. Opinions are my own.
Justin Reginato, Ph.D.
  • About
  • Builder Blog
  • Tacos & Tower Cranes
  • In the News
  • For CM Students

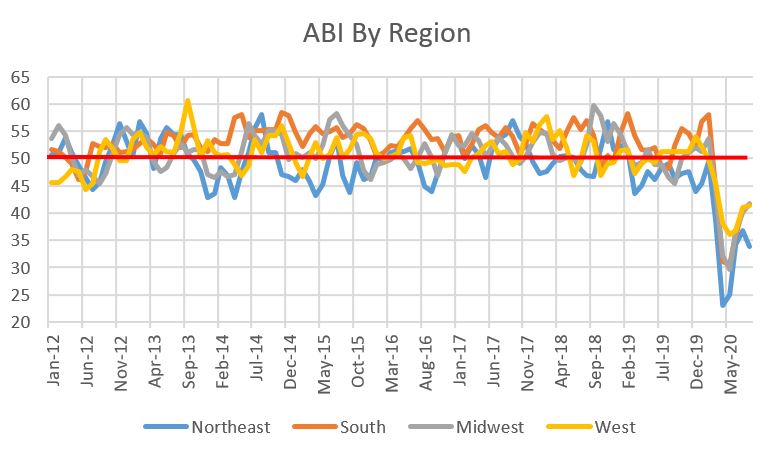
Construction Industry Update: Architecture Billings Flat While Contractor Backlogs Increase

9/23/2020

0 Comments

 
We're three quarters into the month which means it's time to take a look at some economic indicators for the construction industry. Let's start with the leading indicator, the American Institute of Architect's Architectural Billings Index (ABI). As a refresher, the  ABI is a leading indicator of commercial building construction by approximately nine to 12 months. A value greater than 50 means that architecture billings are increasing; any value less than 50 means billings are decreasing. For the third month in a row, the ABI checks in at 40. Still decreasing but at least it's holding steady and up from the low of 29.5 in April.
Picture
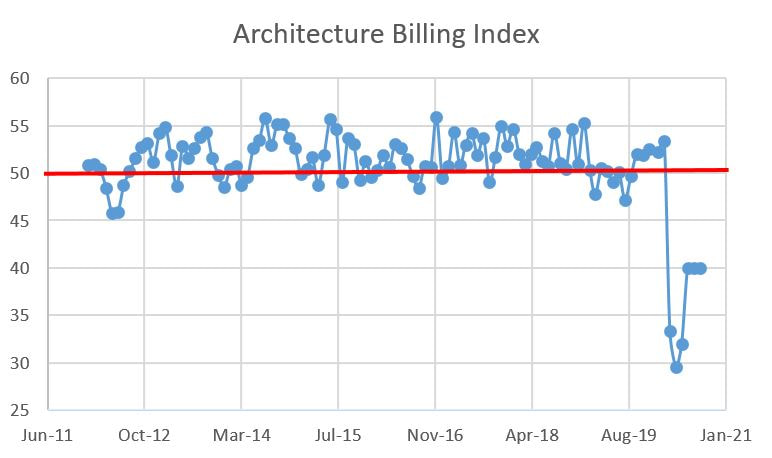
Project inquiries climbed over the 50 hurdle, but recall that inquiries basically represent people interested in projects, not those starting them. Still, we'll take good news however it comes.
Picture
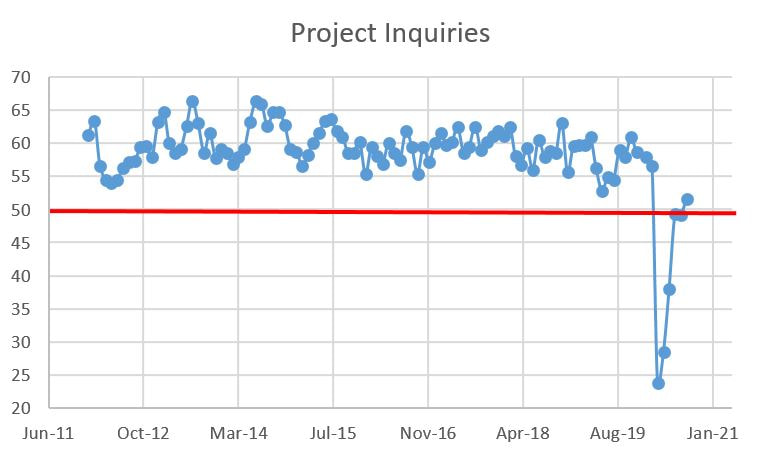
The regional data shows modest increases with the exception of the northeast which turned south after four months of increases. The northeast has consistently lagged its peers. The breakdown for each region is as follows:
  • West: 41.3 (a modest gain from July's 40.9)
  • Northeast: 33.9 (down from July's 36.8, again the only decliner)
  • South: 41.6 (a nice increase from last month's 40.7)
  • Midwest: 41.7 (the best performing region, up sharply from last month's 40.1)
 
Picture
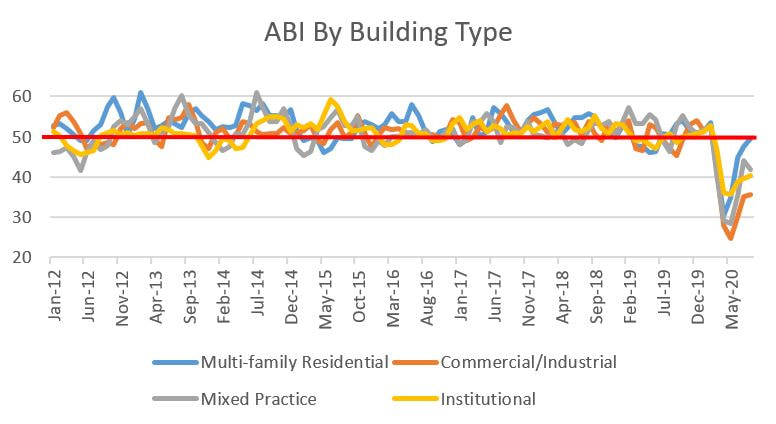
By building type, multi-family continues to be the best performing sector, albeit while still having declining billings. Mixed-practice was the only decliner. The August stats for all are:
  • Multi-family Residential: 49.4 (soooo close to 50; up from 47.5 in July)
  • Commercial/Industrial: 35.5 (up modestly from 35.1 last month)
  • Mixed Practice: 41.9 (down rather sharply from 44 in July)
  • Institutional: 40.2 (up from last month's 39.5)
Picture
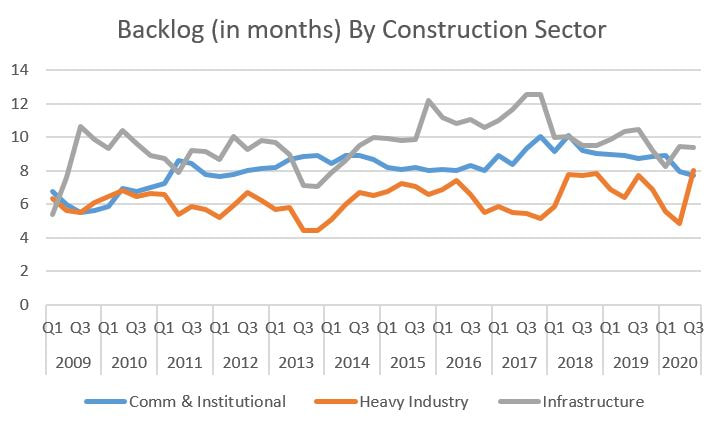
Switching gears from designers to contractors, a bright spot, albeit small, is that contractor backlogs, as reported by the Associated Builders and Contractors, increased last month. The data below is quarterly so the trends still look negative, but we also have one month remaining in Q3 so we may see these curves invert in the right direction next month. Contractors now have an overall backlog of eight months in August, up from 7.8 months in July. 
Picture
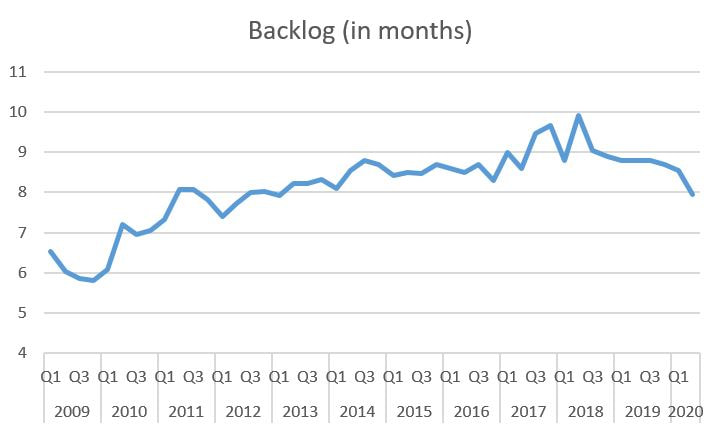
The details are a bit choppy. Let's start with the details by industry sector for August:
  • Commercial & Institutional: 7.8 months (up from 7.6 months in July)
  • Heavy Industry: 7.9 months (down from 8.2 last month)
  • Infrastructure: 9.6 months (up from 9.2 in July)
​The overall quarterly numbers are represented below. It will be interesting to see what these curves look like once Q3 closes next month.
Picture
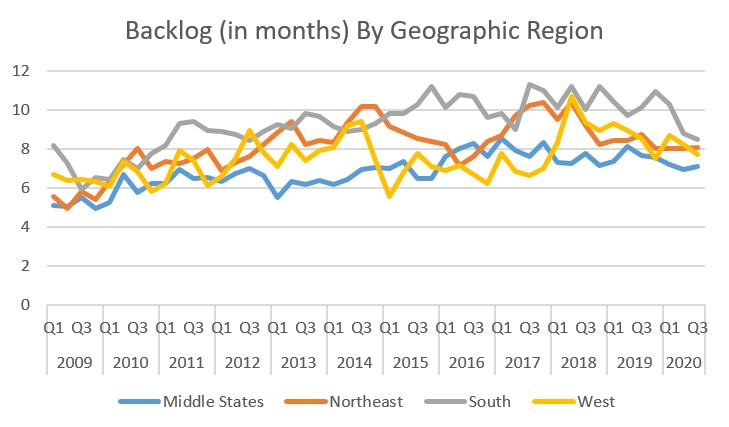
For geographic region, the data is also choppy with bright spots even though the quarterly curves below trend downward. The details are as such:
  • Middle States: 7 months (down from 7.2 months in July)
  • Northeast: 7.7 months (down sharply from 8.4 months in July)
  • South: 8.7 months (up slightly from 8.3 last month)
  • West: 8.9 months (a monster gain from July's 6.5 month backlog)
​The quarterly trends are shown in the figure below:
Picture
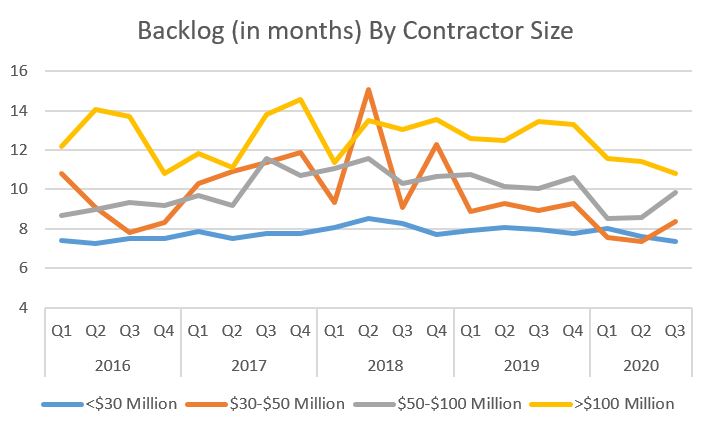
Lastly, the backlog by contractor size is below. The month-to-month data includes some relatively large extremes:
  • <$30 million: 7.4 months (up marginally from 7.3 months in July)
  • $30-$50 million: 9.2 months (a big jump from 7.5 last month)
  • $50-$100 million: 9.2 months (a big decrease from July's 10.5)
  • >$100 million: 11.4 months (another relatively large gain from 10.2 in July)
The score is tied for the quarterly curves with two up ($30-$50 million and $50-$100 million) and two down (<$30 million and >$100 million).
Picture
It's not bold to predict that there could be some more turbulence ahead with election posturing, a possible resurgence of COVID-19 as students return to work and the western states on fire, but in these anxious days, the ABI not decreasing and contractor backlogs increasing, even slightly, isn't too shabby.
0 Comments


Leave a Reply.

    Archives

    November 2022
    October 2022
    September 2022
    July 2022
    June 2022
    May 2022
    April 2022
    March 2022
    February 2022
    December 2021
    November 2021
    October 2021
    September 2021
    August 2021
    July 2021
    June 2021
    May 2021
    April 2021
    March 2021
    January 2021
    December 2020
    November 2020
    October 2020
    September 2020
    August 2020
    July 2020
    June 2020
    May 2020
    April 2020
    September 2019
    August 2019
    September 2018
    June 2018
    April 2018
    March 2018
    February 2018
    January 2018
    March 2016
    February 2016
    January 2016
    November 2015
    February 2015
    December 2014
    November 2014
    September 2014
    August 2014
    July 2014
    June 2014
    May 2014
    April 2014
    March 2014
    February 2014
    January 2014
    December 2013
    November 2013
    October 2013
    July 2013
    April 2013
    March 2013
    February 2013
    January 2013
    December 2012
    November 2012
    July 2012
    May 2012
    April 2012
    February 2012

    Categories

    All
    Economics
    Real Estate
    Technology

    RSS Feed

Powered by Create your own unique website with customizable templates.
  • About
  • Builder Blog
  • Tacos & Tower Cranes
  • In the News
  • For CM Students