|
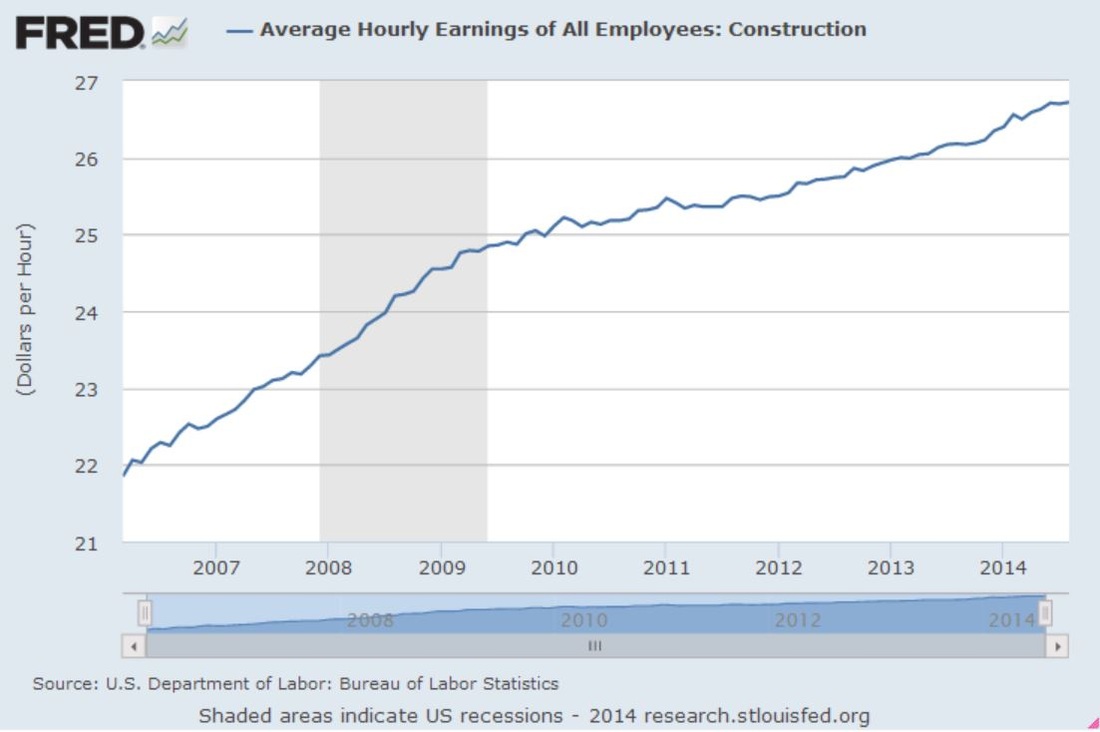
The construction industry added 20,000 jobs in August, which is good news in spite of the fact that the 142,000 total jobs created during the month was considered disappointing. According the Ken Simonsen, Chief Economist for the Associated General Contractors of America, year-over-year construction employment increased in 223 U.S. metro areas, decreased in 72 metro areas, and was static in 44. In some areas, companies are finding it difficult to find skilled labor. Perhaps the shortage of labor will increase wages, which were flat (aggregated for the entire U.S.) from July to August. 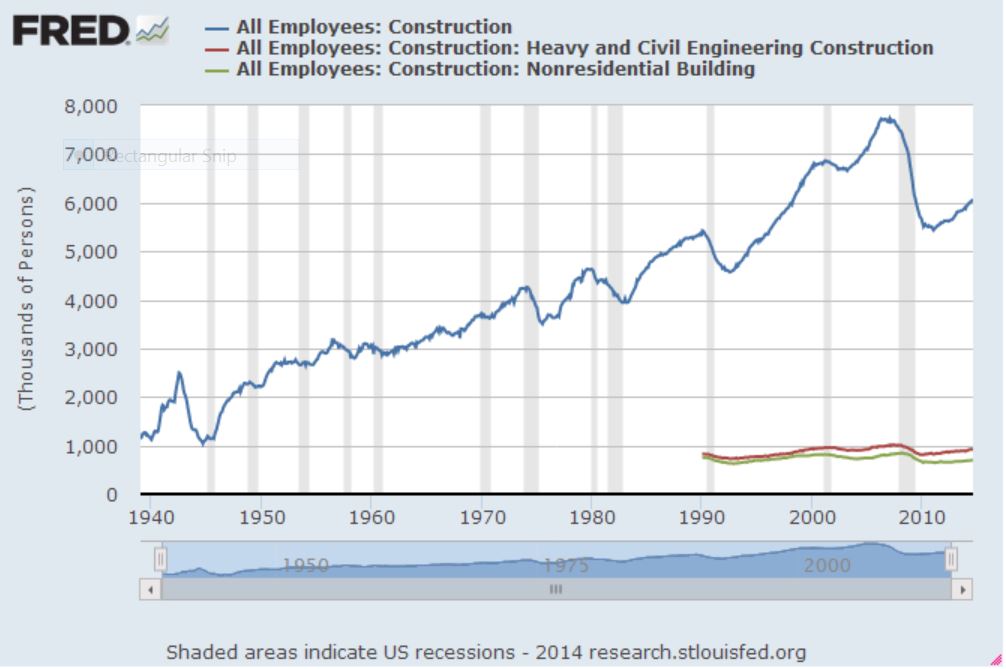
0 Comments
Check out this article: "U.S. is Entering the Next Couple of Years with One Distinct Advantage". It's a bit wonky if you don't have an interest or background in economics, but here's the Cliffs Notes version:
There is pent-up demand for capital projects, whether new offices, factories, etc. on the private side or infrastructure on the public side. Corporations have been hoarding cash and issuing bonds for even more cash because of the low interest rate environment. At some point they will have to deploy that cash. And given the need for capital facilities and the specter of rising construction costs, now is a pretty good time to break ground on new projects. Given the increasing ABI reported a few weeks ago, we could be on the cusp of a significant increase in construction activity. It's been a while since I've last blogged on the state of the construction economy. For a short period of time, I thought the summer was ironically signalling a cool down in the market given that the Census Bureau reported that construction spending was down in June, both for private and public construction. But last week, negativity shifted to optimism when the American Institute of Architects released their July Architectural Billing Index (ABI), which revealed billings are up to its highest level since 2007 (pre great recession levels). July's ABI was 55.8, up significantly from 53.5 in June (any value greater than 50 means that architecture billings are increasing; conversely, any value less than 50 means billings are decreasing; the ABI is a leading indicator of commercial building construction by approximately nine to 12 months). The details are as follows:
Regional (three month moving) Averages for July 2014:
It's important to note that the regional reports do not always signal widespread distributed increases/decreases throughout the region. For example, the coastal cities in the west (San Francisco, for example) remain strong, while the cities farther inland (Sacramento, Las Vegas, etc.) are relatively weak. Sector Averages for July 2014:
Project inquiries are up to 66.0, astonishing given the figures over the past few years. A new measure, Design Contracts Index (which I'll admit I need to learn more about) is at 54.9. All in all, very strong data that hopefully signifies that we're heading into a stable period of continued growth in the construction industry. I look at construction economic data a lot. As such, I constantly need to remind myself to take monthly data with a grain of salt; the economy is dynamic and it goes up and it goes down, we just hope there are more ups than downs. That said, the Reed Construction Data (RCD) report for June construction starts (excluding housing; basically commercial, industrial and heavy-civil construction) were up big time. The increase from May to June was 34%, up to $32 billion. This comes on the heals of a boffo ABI report. RCD's volume hasn't been this high since June 2008. The details are 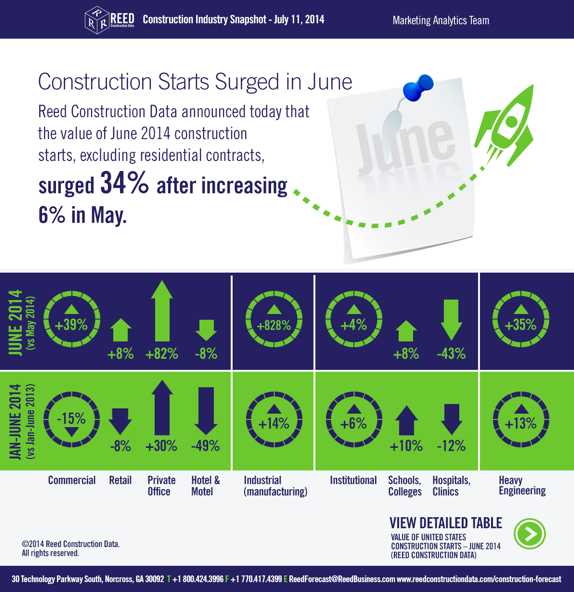
Some of this gain was due to abnormal outsized gains (so unlikely to be sustained on a monthly basis), but the numbers are solid nonetheless. Build on builders, build on!
Despite my love of my favorite economic indicator, the AIA's Architectural Billings Index (ABI), I'm a bit late blogging about it (I blame the World Cup--I've been distracted). What matters is that the figures for May are up sharply to 52.5 from 49.6 in April. The details are below (any value greater than 50 means that architecture billings are increasing; conversely, any value less than 50 means billings are decreasing):
Regional (three month) Averages for May 2014:
This is the West's second month of declines, which troubles me. The West has been hot for a while, so we'll see if the declines have legs. Everything is cyclical, and as I've said in the past, there are still regions in the West that are booming (SF/SJ Bay Area, etc.). Sector Averages for May 2014:
The Inquiry Index is at 63.2 for May, up from 59.1 in April and 57.9 in March. This is correlated to more good news going forward. Hopefully these ABI figures, along with other construction economic indicators, shows the industry is ready to break out. Residential and Public Sector Construction Spending is Up, Non-Residential Building is Down Again6/5/2014 The Department of Commerce's U.S. Census Bureau reported construction spending for April 2014 a few days ago. April's figure of seasonally-adjusted annual rate (SAAR) is $953.5 billion, up 0.2% from $951.6 billion in March. Modest improvement, but the details are more telling. The SAAR for private construction was essentially flat at $686.5 billion, down a hair from $686.8 billion in March. Public construction, which has been on a long downward slide, ticked up 0.8% to $267 billion in April, above March's figure of $264.8 billion. I will come back to public-sector spending in a separate post in the next day or two because it's an interesting topic these days. 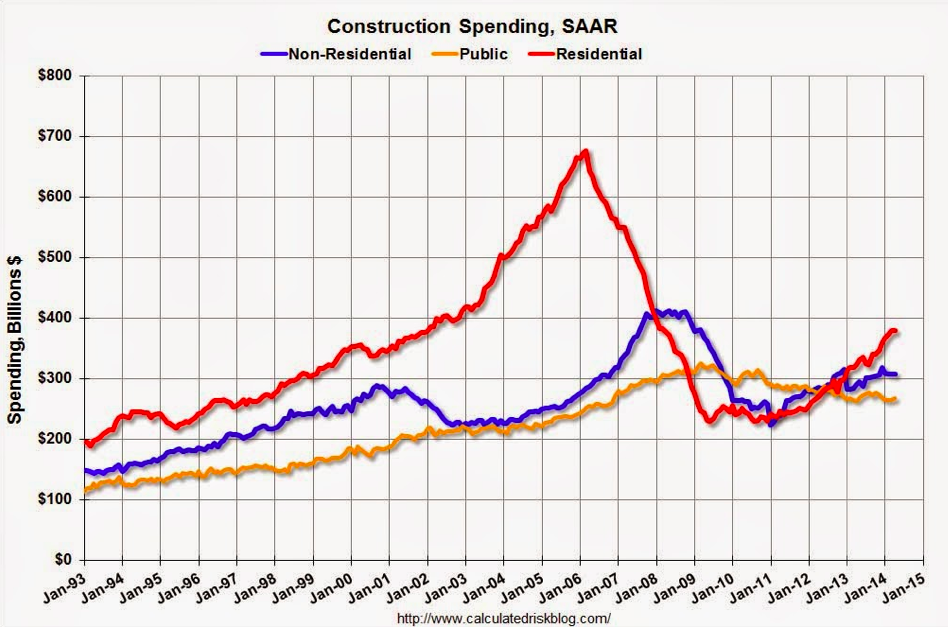
The increase in public sector construction spending is good for the construction industry. As Bill McBride from the Calculated Risk shows in the above figure, residential is also health. There are even more details to highlight, though.
Non-residential spending is down for the fifth month in a row, decreasing 1% in March after a 1.3% drop in February. Not necessarily a good sign. Fortunately, the residential market, combined with the public sector, picked up the slack. Residential was up 0.7% in March after being down 0.3% in February. The single-family housing starts were up 0.8% in March, but the bigger story is that the multi-family went bonkers and was up 3.2% in March after being up 2.8% in February. This makes sense to northern Californians as the multi-family market has been hot for some time, particularly in the Bay Area. A bit of a mixed bag, but so long as the overall spending is increasing, the construction industry as a whole will continue to strengthen. Typically, I love receiving AIA's Architectural Billings Index (ABI) figures--it's my favorite economic indicator. But it's definitely less fun when the ABI is less than 50 (any value greater than 50 means that architecture billings are increasing; conversely, any value less than 50 means billings are decreasing). So when April 2014's ABI came in at 49.6, I was a bit disappointed. The silver lining: it's up from March's 48.8 figure. Huzzah…
As always, the details are a bit more revealing. Regional (three month) Averages for April 2014:
The west's slide to contraction is discouraging, as it's been fairly hot for a while. The south is booming and has been strong for a while. Sector Averages for April 2014:
Another bright spot (so long as we're looking for silver linings): the Inquiry Index is at 59.1, up from 57.9 in March. AIA Chief Economist Kermit Baker states that "Despite an easing in demand for architectural services over the past couple of months, there is a pervading sense of optimism that business conditions are poised to improve at the year moves on." Last week, the U.S. Bureau of Labor announced that the economy added 288,000 jobs and the unemployment rate dropped to 6.3%. For the uninitiated, this is good news. More importantly for this readership, the construction sector is adding jobs at a very healthy pace. Here is the annual change in construction jobs over the past 12+ years: 2002: -85,000 2003: 127,000 2004: 290,000 2005: 416,000 2006: 152,000 2007: -195,000 (the pain starts) 2008: -789,000 (damn, this is beginning to hurt) 2009: -1,047,000 (we were just given a standing eight count) 2010: -192,000 (damn, this is one heck of a hangover…) 2011: 144,000 (so glad that episode is over) 2012: 114,000 2013: 156,000 Through April 2014: 124,000 (372,000 for all of 2014 on an annualized rate) Here is the most recent data in graphical form showing a nice recovery: 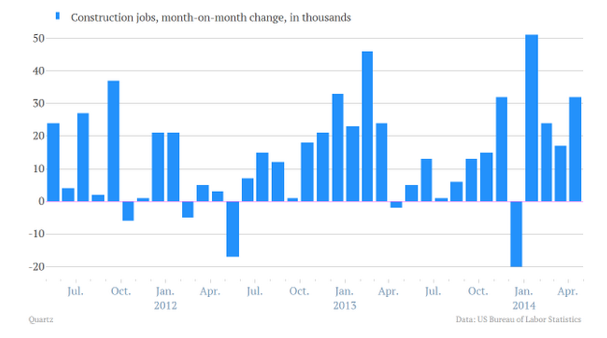
Here's a graph of longer-term construction employment. You can tell that there was one heckuva run up from approximately 1995 to 2006. (Graph from the Calculated Risk Blog) 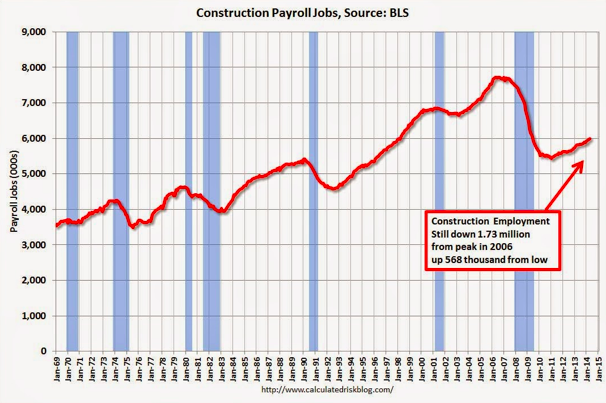
It is unlikely we'll see construction employment as high as it was in 2006. But the good news is that construction companies are hiring again. This is good for college grads majoring in construction management, civil engineering and architecture. Hiring at Sac State's CM program has been very robust and we may have our third year of 100% job placement for grads in a row.
The U.S. Census Bureau reported yesterday that construction spending during March was a seasonally-adjusted $942.5 billion, or 0.2% above February's revised estimate of $940.8 billion. This March 2014 figure is 8.4% above March 2013's number. What's astonishing is that the gains are primarily from private construction projects. It's typically for public-sector construction spending to increase as a means for leading the economy out of a recession. Governments spend on infrastructure, etc. to create jobs (remember the discussions of "shovel-ready" projects that would get funded by federal TIGER grants?) and there was a peak in public-sector spending in early the first half of 2009. But since then, as the economy continues to improve (today's jobs number, an increase of 288k jobs and unemployment down to 6.3% shows an improving economy), it's been the private sector, as far as construction's concerned, that's leading the charge. Private construction's seasonally adjusted rate in March was $679.6 billion, an 0.5% increase from February. Public construction's was $262.9 billion, a 0.6% haircut from February's $264.5 billion number. Everything is off their peaks of past, but we're seeing some nice gains from residential and non-residential construction. Any improvements in public-sector construction, which given that our national infrastructure is in shabby shape and infrastructure will be necessary to support continued housing and commercial construction, will bolster the improving economy. 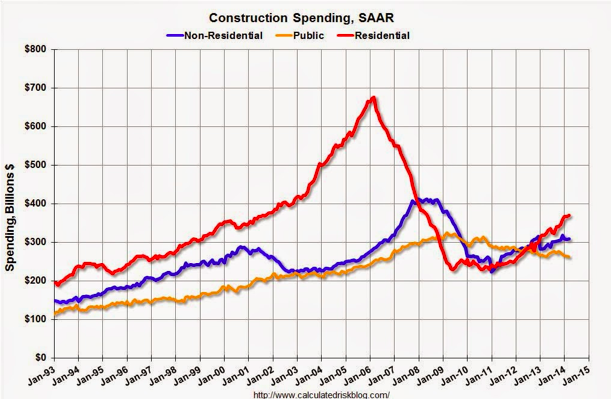
For more information, be sure to check out this post by Bill McBride.
Things go up, things go down...The AIA ABI figures for March 2014 were just posted and the nationwide number fell to 48.8, down from 50.7 in February. This is a pretty sharp fall, but like anything, the devil is in the details and I'll get to that soon. But, as any value greater than 50 means that architecture billings are increasing (and conversely, any value less than 50 means billings are decreasing), a fall from 50.7 to 48.8 is not good news. Architectural billings are a nine to 12 month leading indicator for construction activity. But most of the damage is in certain regions, which are shown below:
Regional Averages for March 2014:
The west continues to be strong, but as mentioned last month, the strength is concentrated in major metropolitan areas (San Francisco/San Jose is still very hot). This shows that even within large regions, there are pockets of strength AND weakness. Sector Averages for March 2014:
The multi-family residential market continues to pace building construction, which has been an on-going trend. Yet, the slight decline will be worth watching. The decrease in commercial/industrial is also worthy of attention, as the recent drop is mildly troubling. One bright spot in the new data: project inquiries increased to 57.9 from 56.8 in February. |
Archives
January 2024
Categories |
 RSS Feed