|
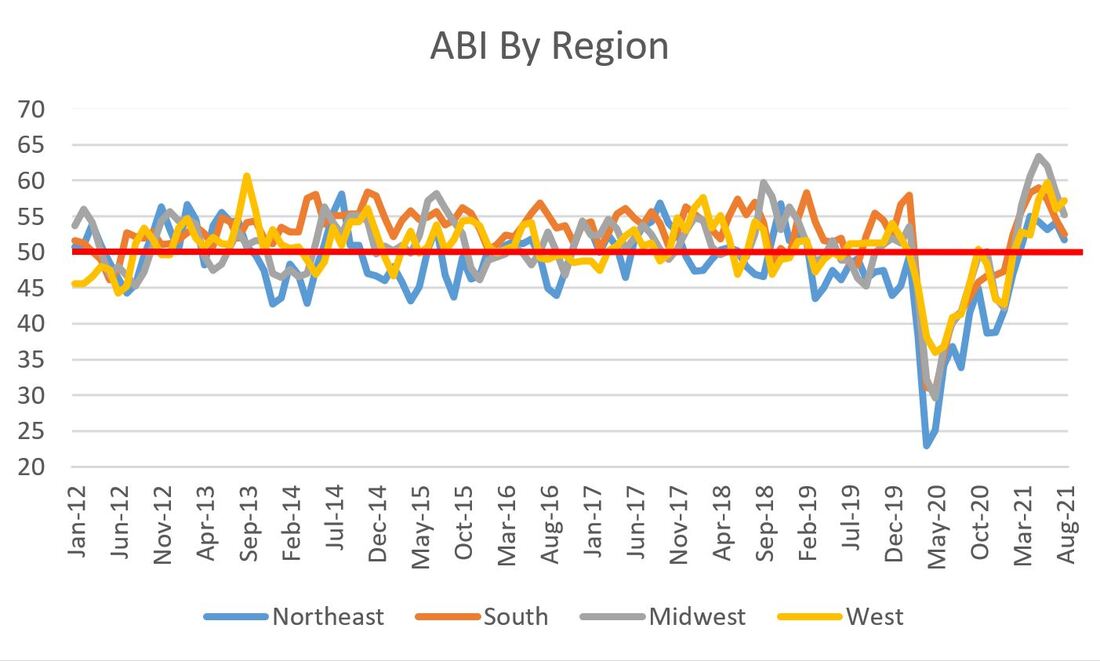
The American Institute of Architects (AIA) released the July Architecture Billings Index (ABI) today and the value for August came in at 55.6, above July's 54.6. After two months of declines, an uptick is welcome news. The market for design services remains robust, particularly in contracts to a historic (since 2012) average of 50.8 and in stark contract to a bottoming out o 29.5 in April 2020. As a reminder, the ABI is a nine-to-12 month leading indicator of construction activity. A value greater than 50 means that architecture billings are increasing; conversely, any value less than 50 means billings are decreasing. 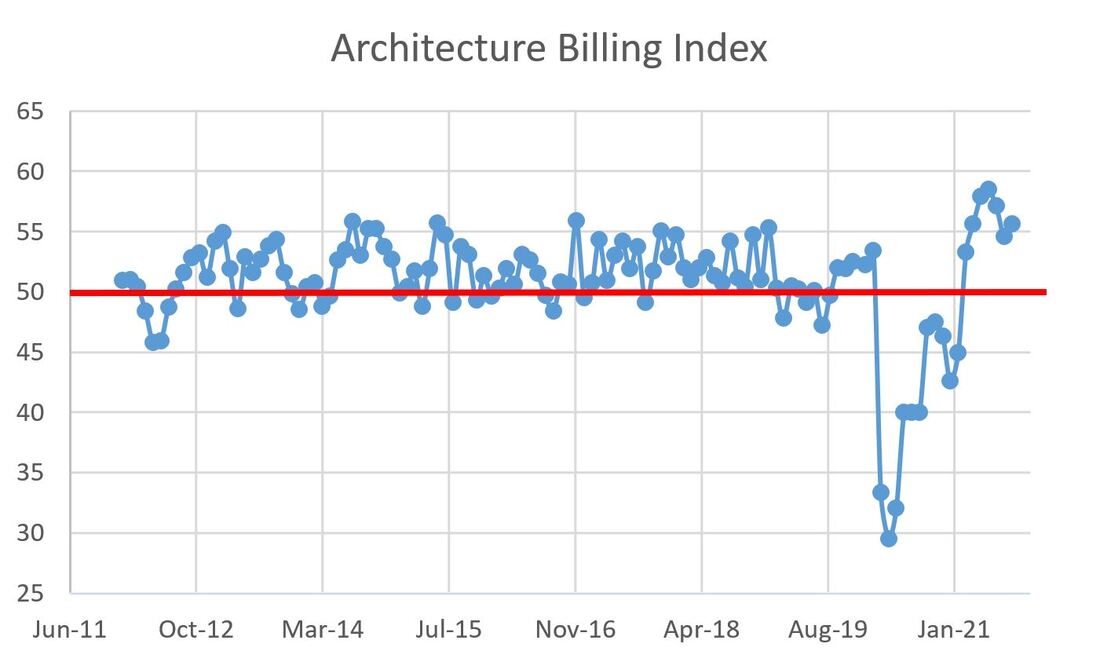 Here's where things get tricky: while the overall ABI is up, there were declines in three of four geographic regions. All are still relatively strong markets, but the overall gains seem to be the handiwork of the West Coast:
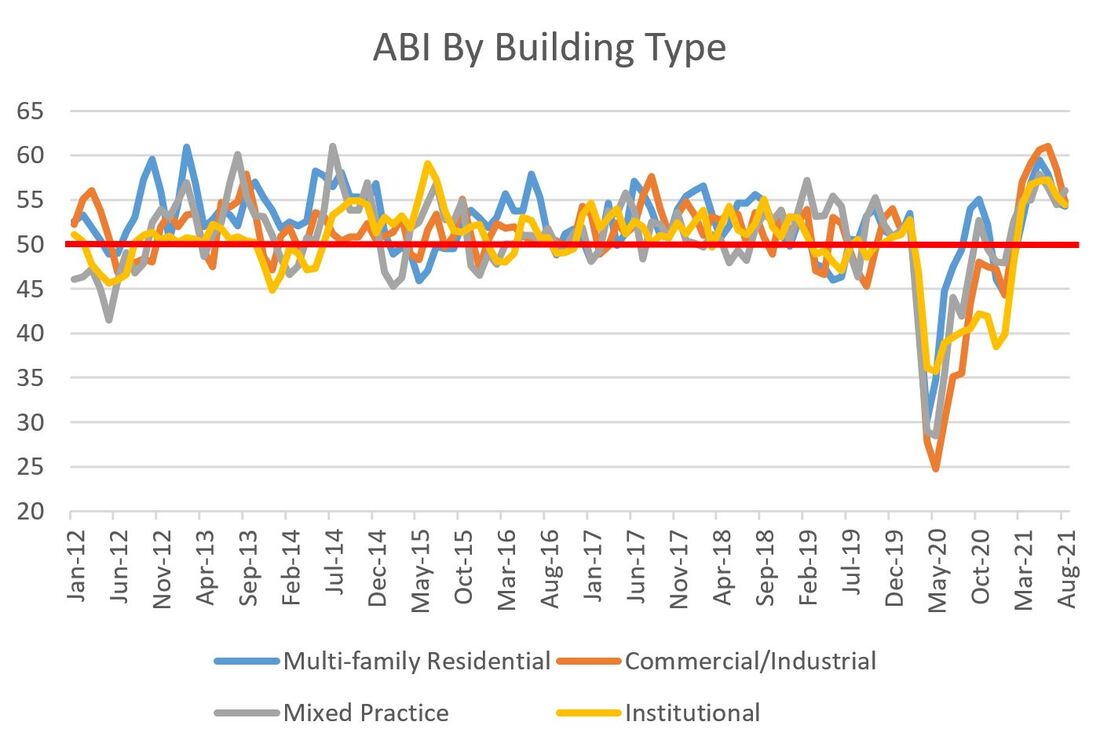
 Similar to geographic area, three of the four project categories were also down, leaving Mixed Practice as the only gainer.
 Project inquiries were down slightly, from 65.0 in July to 64.7 in August and still strongly above the average of 58.5 (also since 2012). So, overall ABI is up but six of the eight subcategories are down. This isn't the first time this has happened nor is it anything to be overly concerned about. None of the subcategories seem to be hurtling negatively towards the 50 level. Not too shabby.
There are a few casual observations I have made that i will keep an eye on. First, if you didn't click the link above, I checked out the tower cranes in San Francisco last week and I could not help but notice that there are significantly fewer cranes up. There were 24 up a year ago and I saw five last weekend. Of those five, three are located in areas outside of the core business and housing districts, meaning that development is heading to the frontiers, as it does at the tail end of bull building markets. Combine this with the robust Sacramento market, which always coincides with the Bay Area getting overheated and people look for less expensive places to build, and my gut tells me northern California is about to slow down. Now I know there are a million holes you can shoot in my logic (chiefly, the boom in Sac is California government buildings which are not directly related to private development in San Francisco), but it's a hunch I will track. Secondly, the Midwest has been fairly hot as of late, yet if STL is any indicator, the tower crane activity there is outside the downtown area. Granted, there is plenty of activity near the Washington University Medical Center, but the rest of the action was in the 15,000-person suburb of Clayton and Milwaukee was really quiet. Again, my non-scientific gut feels like the froth in the market may be subsiding. I hope I'm wrong.
0 Comments
|
Archives
January 2024
Categories |
 RSS Feed