|
We are in strange times. The Federal Reserve Bank is increasing the effective fed rate in an effort to cool inflation, which is a response to a hot market. And yet demand persists. People keep spending money on houses (if they can find one), cars, COVID revenge travel, etc. Where is our pain threshold? How high do interests need to go before the market taps out? While one data point does not define a trend, the most recent report on Architectural Billings Index (ABI) published by the American Institute of Architects, delivered a 50 handle. The ABI is a nine-to-twelve-month leading indicator of building construction activity, with ABI measures above 50 indicating that billings are increasing and those below 50 signaling a decreasing billings. So July's reading is neither going up nor down. Is this the breaking point? 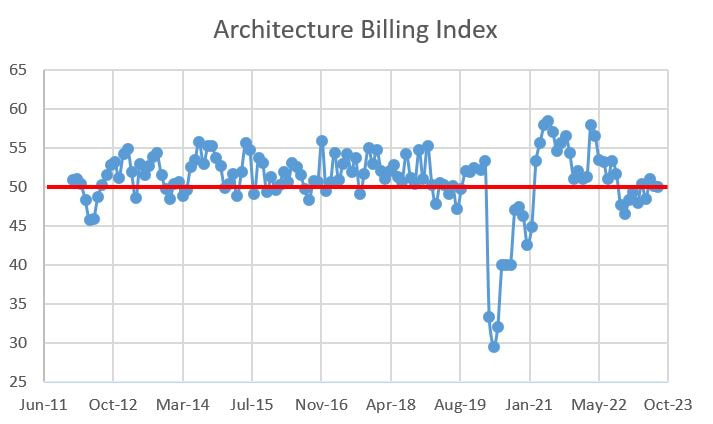 The details show a more mixed picture. The Midwest has increasing billings, while the other geographic areas are down. In terms of product, Commercial/Industrial and Institutional are up while Multi-family and Mixed Practice are cratering. Project inquiries, a measure of people planning projects for the future, is above solidly above 50, but it is way below the average for the past 11 years. Good news plus bad news equals break even. 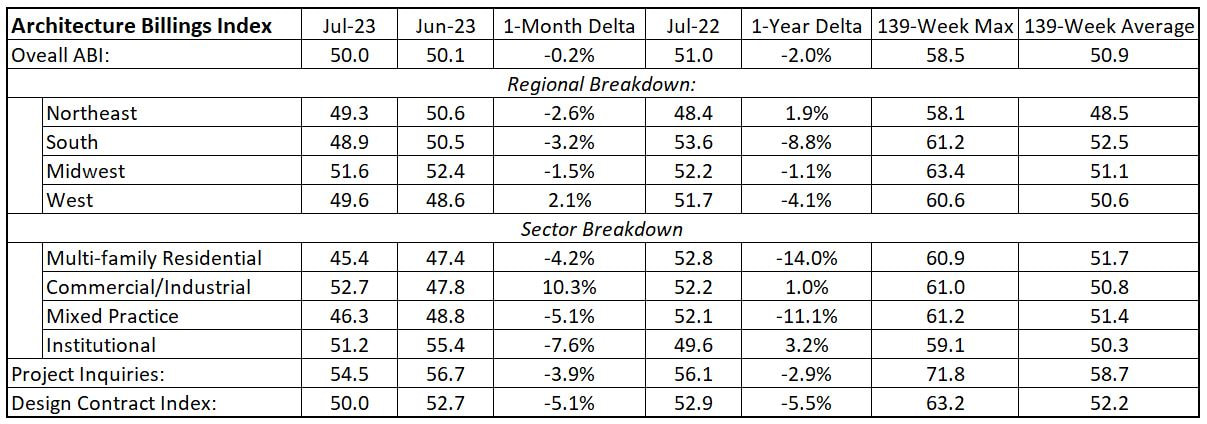 The next few months will be very revealing. While the Fed indicated a week ago that they are done hiking rates for the near term, it is maintaining optionality to increase funds later this year. Which is Latin for they are waiting for more info before making a definitive call. Just like the rest of us. Until then, hold on tight. The details follow: 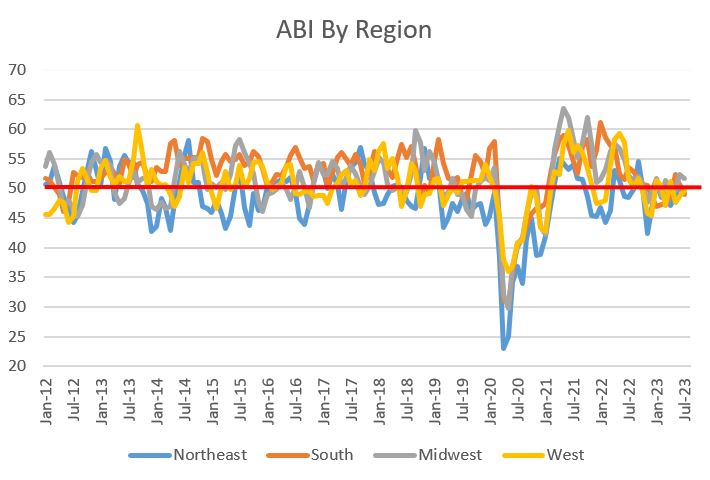 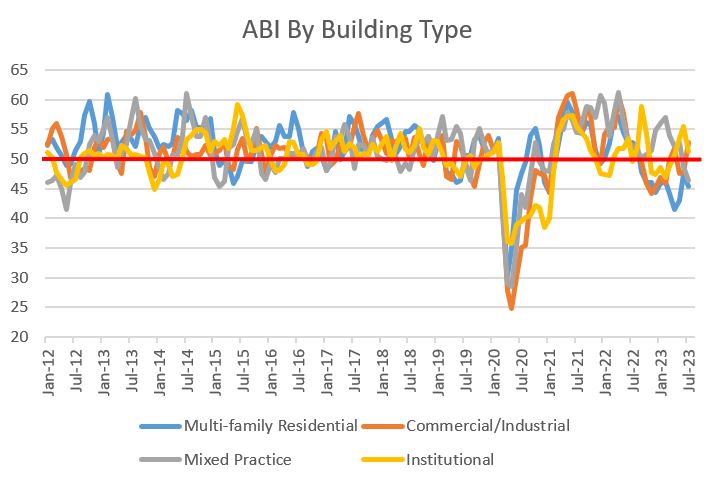 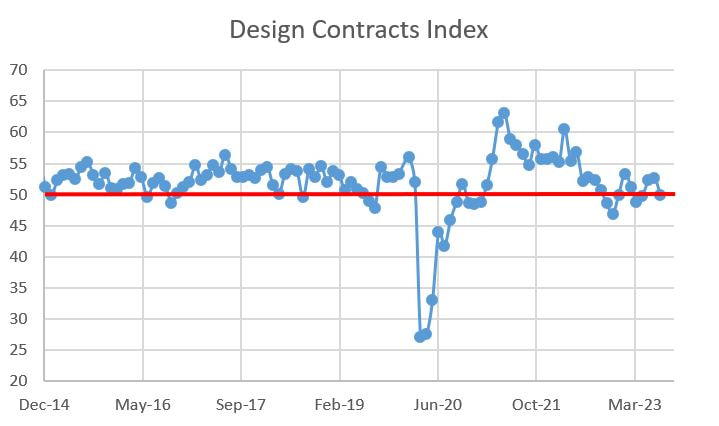 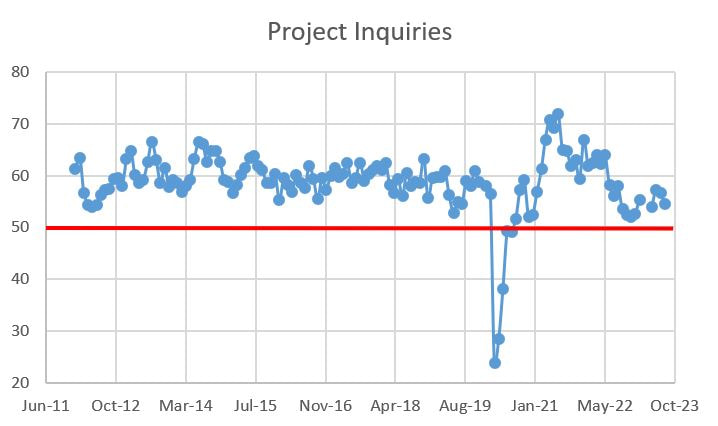
0 Comments
For as long as I have been analyzing construction economic data, I have been fascinated by backlog. Backlog, expressed in dollars, is the amount of work companies are contracted to perform in the future. Backlog can also be expressed in time (typically months) as the amount of work that would keep a contractor busy if no other contracts were executed. Essentially, it is a measure of how busy contractors are. The Associated Builders and Contractors (ABC) tracks backlog and reports it monthly and their methodology can be found here. Backlog is important, because it is a proxy for a contractor’s near-term economic health. If a company has a strong backlog, it can either be more selective about the additional work it pursues and/or increase its proposed fee on the work it pursues. If fees increase, profit, in theory, should also increase. On the flipside, a relatively small backlog indicates weakness, implying contractors must chase work more aggressively, typically eroding profitability. Given that backlog is used to gauge an architecture/engineering/construction (AEC) company’s economic health, it would make sense that people with an economic interest in an AEC company would want to know the backlog to help determine if they should hold or sell their investment. Sure enough, for companies that must report financial performance, chiefly firms that are publicly traded on major U.S. stock exchanges, they do tend to highlight their backlog as an indicator of future performance. There are not that many publicly-traded AEC firms, but in the construction financial press, AECOM, Fluor Corporation, Granite Construction Inc., Jacobs, and Tutor Perini, prominently report their increasing backlogs. Whether the financial reports are good, bad or ugly, backlogs are typically featured prominently to magnify good news and deflect bad news. Think I am being cynical? Check out the press releases from this recent quarter:
My curiosity having been piqued, I wanted to use publicly-available financial data to see if there is a simple link between backlog and profitability. Hoping to avoid performing a linear regression to determine any causality, I will compare the financial performance of the five previously-mentioned firms from the most recent quarter to the corresponding quarter 10 years prior. (That sentence was not completely correct…I actually really want to perform a linear regression as it will scratch my nerd itch. But given a lack of time, I’m hoping to catch lightning in a bottle with an incredibly basic analysis.) Before diving into the results, keep in mind that total construction spending in the United States increased from $ 2,784,938 million in the third quarter of 2013 to $ 5,772,918 million in the second quarter of 2023 (10 years total), and increase of 107.3%. Over that same period, the United States Gross Domestic Product (GDP) increased from $ 16,911,000 million to $26,834,001 million, or 58.7% increase (yeah, those are really large numbers). We want to normalize the five AEC companies’ results against a raising U.S. economy over those 10 years, as revenues and backlog should catch a tailwind and grow as the U.S. economy grows. 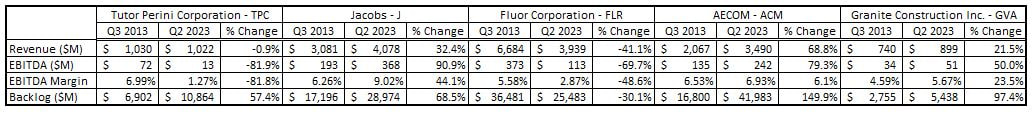 The figure above is comically small, so I will summarize it in bullet points:
Based on connecting two reporting periods ten years apart, there does not seem to be a strong link between backlog growth and profitability. There are a lot of holes in the analysis, chiefly:
While not pure-play contracting entities, the companies analyzed above are AEC industry bellwethers. I would greatly like to add some publicly construction companies to the database, namely Skanska and Balfour Beatty, but they are listed on European exchanges and thus have different reporting requirements (different measure of profitability), so that will take some time. As for more in depth data analysis, it looks like my next move is a linear regression. Stay tuned for those results. Until then, there is no obvious correlation between increasing backlog and increasing profitability based on this basic analysis. |
Archives
January 2024
Categories |
 RSS Feed