|
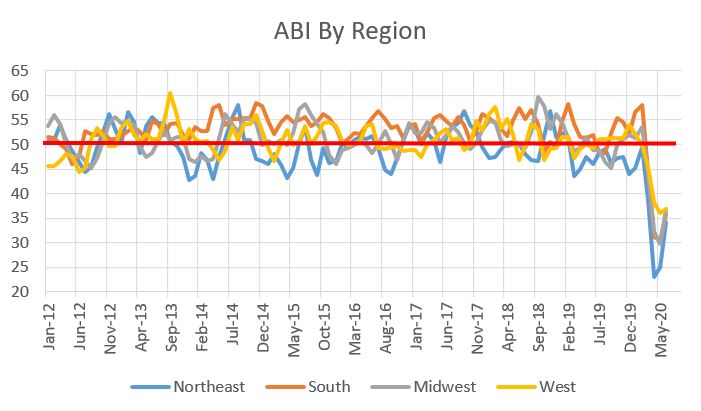
Let’s start with architecture billing. I smell a positive trend! The American Institute of Architects (AIA) Architecture Billing Index (ABI) is continuing to rebound, posting a 40 in June, up from 32 in May and 29.5 in April. While the trend is good, let’s not forget that 40 is still pretty lousy. As a reminder, ABI is a leading indicator of commercial building construction by approximately nine to 12 months. A value greater than 50 means that architecture billings are increasing; any value less than 50 means billings are decreasing, which is the case for the past four months. The overall ABI is as follows: 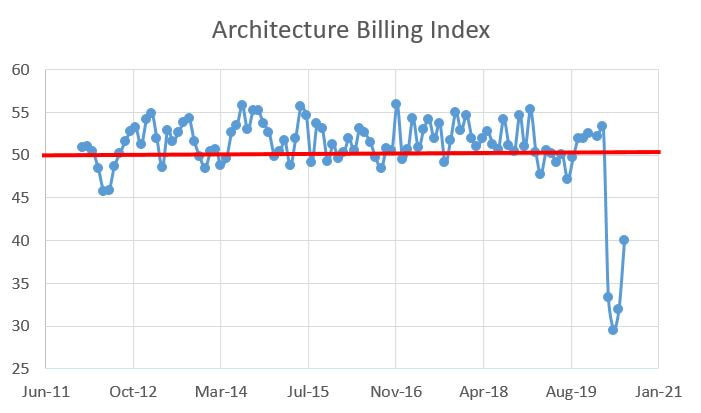 Still, up is up and it seems the AEC industry is starting to adjust to a COVID-dominated world. As for the regional breakdown:
 The Sector Averages for June 2020 are as follows:
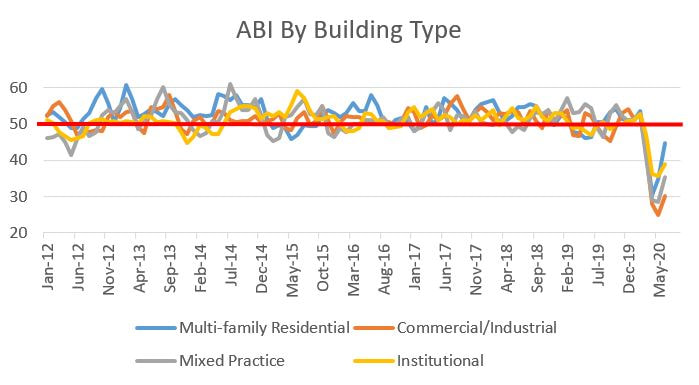 So on the one hand, we are clearly numerically up from the lows experienced in April. On the other hand, the scores are below 50 across the board, demonstrating that billings are shrinking (just not as fast). How about contractor backlog? If the ABI represents what may happen in about a year (the hope), then what do contractor backlogs (the promise) look like? The graphs below show a decrease in contractor backlogs, but the x-axis is in quarters. The good news is that, according to the Associated Builders and Contractors, collectors of the backlog data, backlogs increased last month and optimism is rebounding. 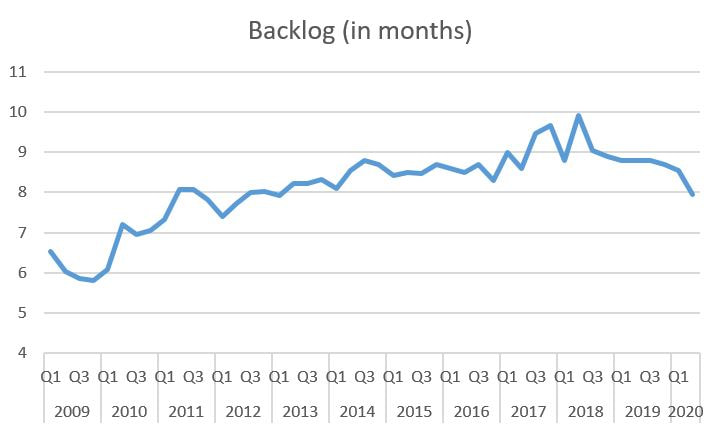 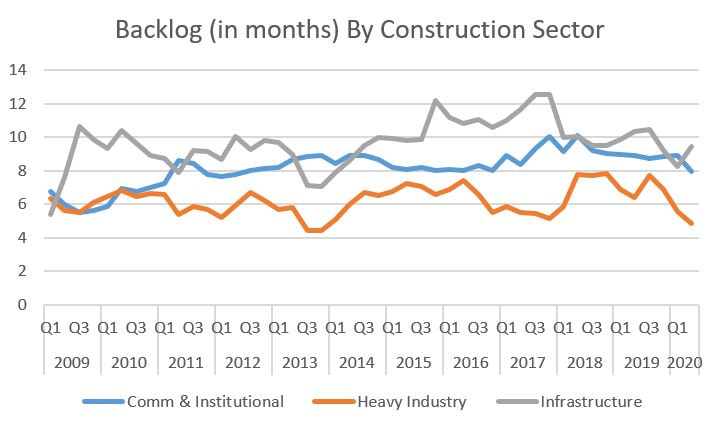 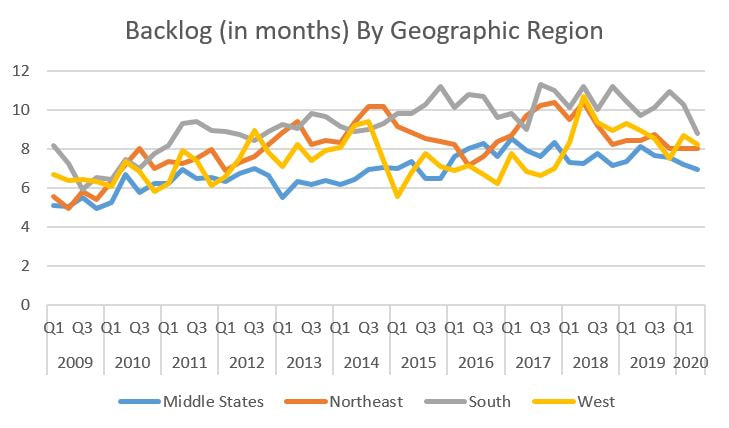 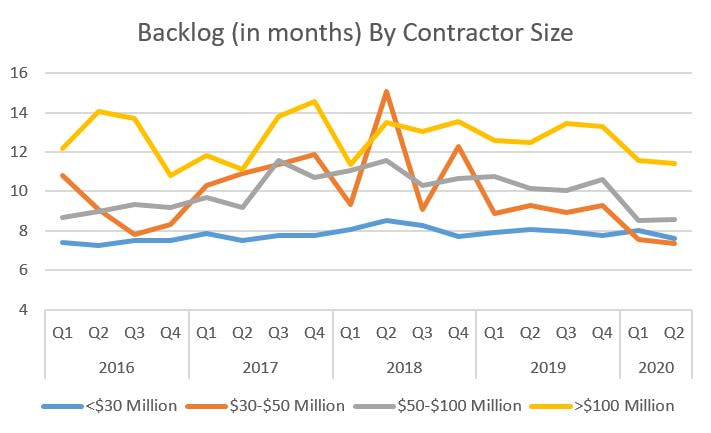 Backlogs are down considerably from their peaks, but what’s missing (and possibly smoothed out due to the quarterly vs. monthly data) are the huge drops we witnessed in the various ABI measures. I don’t know this for a fact, but I highly suspect that this is due to the relative ease of canceling (or not starting) design as opposed to the relative difficulty in terminating projects, particularly large projects (notice the line for $100 million + projects is consistently higher than others) once a general contractor is selected. This is particularly the case for public-sector projects, many of which take years to get approval from and once funds are allocated, they are typically locked in place (infrastructure, which is commonly publicly-financed, actually increased its backlog last quarter).
All in all, we seem to be off the bottom and it doesn’t appear to be a false bottom (fingers crossed). I speculate that the ABI figures will remain under 50 as we pass the COVID-19 economic kidney stone, but any climbing towards 50, no matter how tiny, will help the AEC industry weather this storm.
0 Comments
Leave a Reply. |
Archives
January 2024
Categories |
 RSS Feed