|
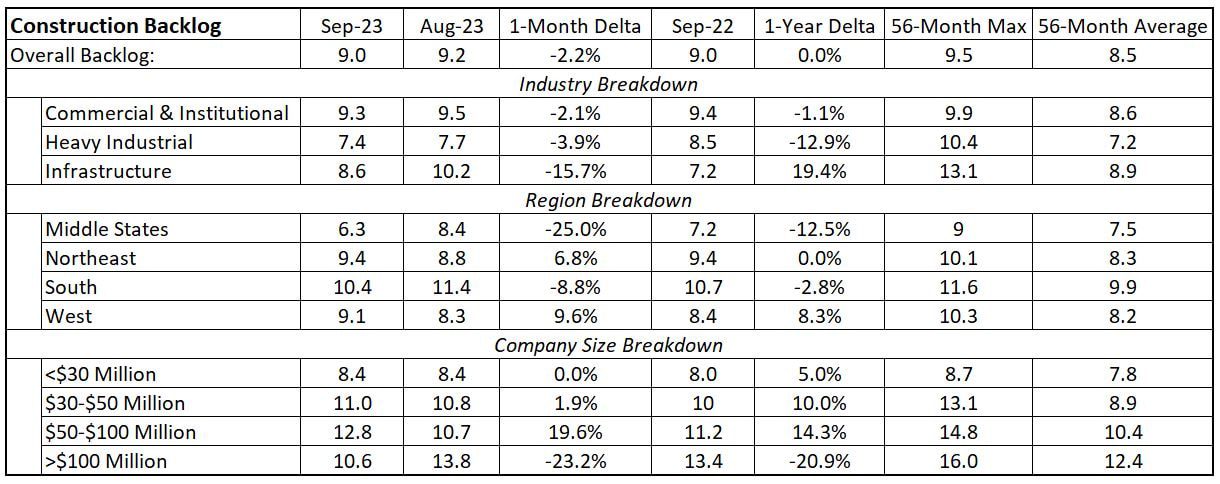
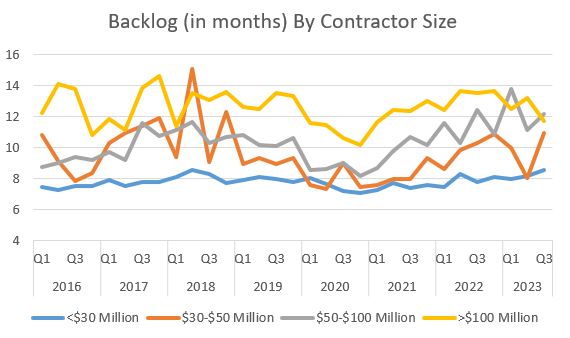
Yesterday I wrote about the recent declines in architectural billings, which are a nine-to-12 month leading indicator of construction activity. Since nine of 12 billing categories have declined year-over-year, now is a good time to check in with how declining billings are affecting builders. We can use my other favorite construction economic indicator, contractor backlogs, to make the determination. The most recent backlog figures, published by Associated Builders and Contractors as the Construction Backlog Indicator (CBI), in fact show a decline in backlogs. Backlog can be represented two ways. It can be measured in dollars as the amount of future work under contract or represented as the duration of time that a contractor will be busy without adding any additional work (the figures below use the latter, represented in months). In either case, it is a representation of how busy contractors are. Overall, backlogs are down over the past month, yet they are breakeven year-over-year. Unlike architecture billings, the subsectors of backlog measures are a bit more mixed. While all construction sectors slid, the geographic sectors are 50/50 in terms of gainers and decliners. The Northeast is particularly interesting. After lagging most other regions for several years, architectural billings in that region are up, both month-over-month and year-over-year, while its backlogs are up and even, respectively, demonstrating relative strength. The region to watch closely is the West, which has declining billings MoM and YoY but has increasing backlogs. If billing are correlated to backlogs with a 9-12 month lag, then we would expect backlogs to start declining in the next few months.
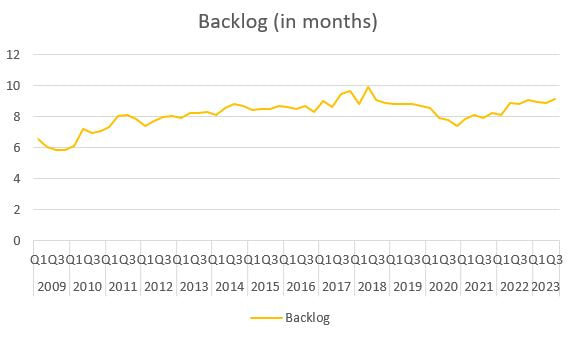
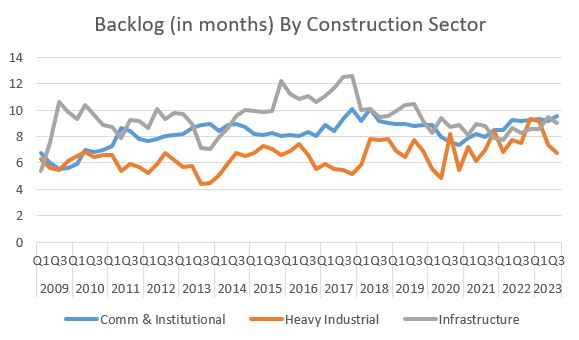
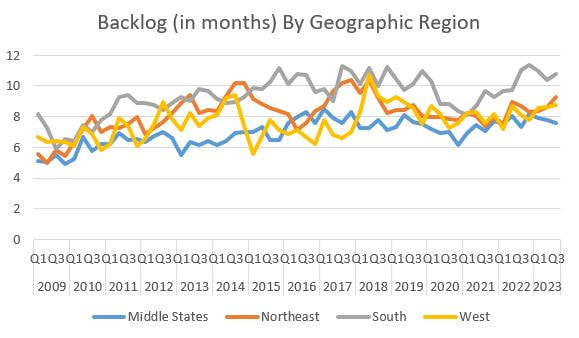
Another interesting side note are the large, double-digit declines in Infrastructure, Middle States and >$100 million contractors. There have been a lot of projects in the Midwest targeted by the recent Federal infrastructure investments, yet the data states otherwise. Perhaps it is too soon for the funds to represent actual construction activity. One last side note is that while overall backlogs have declined and some subsectors have declined precipitously, most contractors I speak with are still really busy. That is to to say that the industry is not slowing, yet it really feels, at least for the time being, that the industry is no longer crazy busy. The Federal Reserve Board has been trying to gently slow the economy by raising the Fed rate, so hopefully any future declines in backlogs are measured and help normalize construction costs. Historical backlog data is shown in the below graphs.
0 Comments
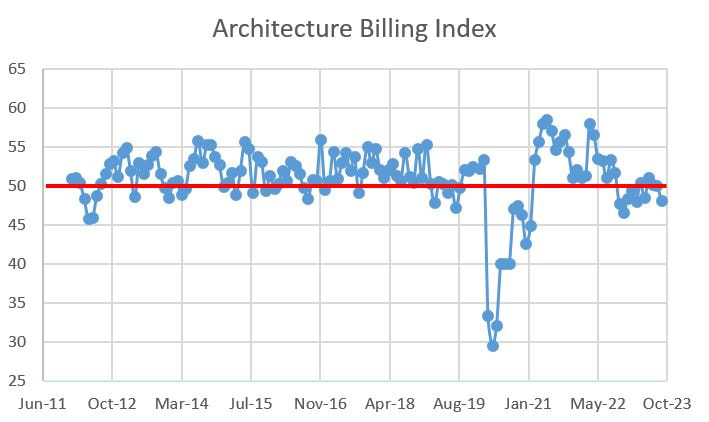
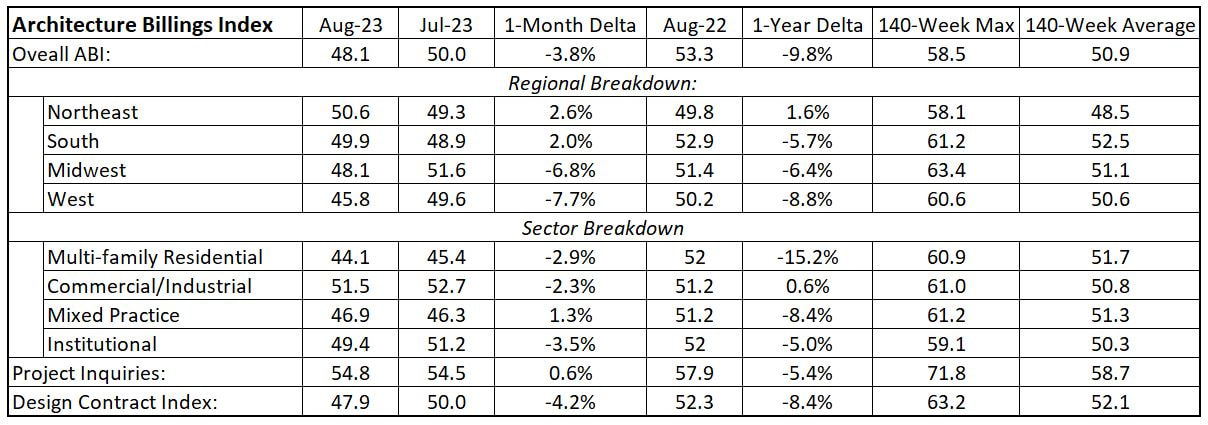
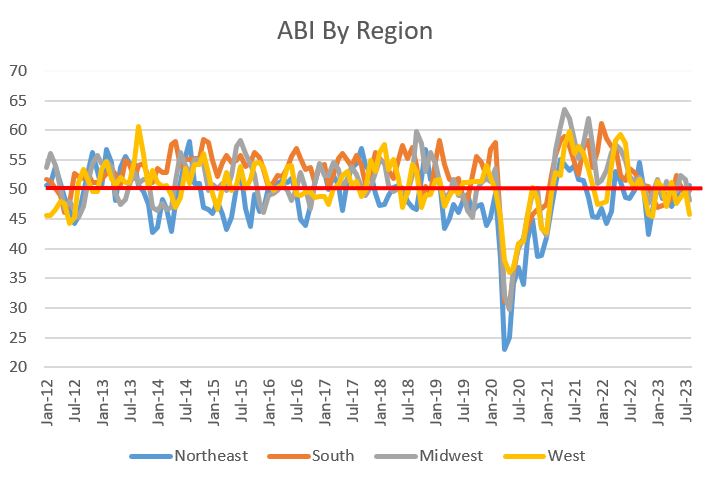
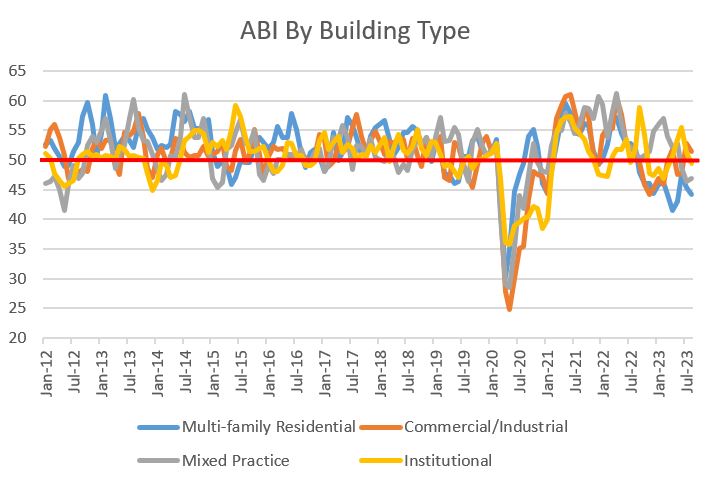
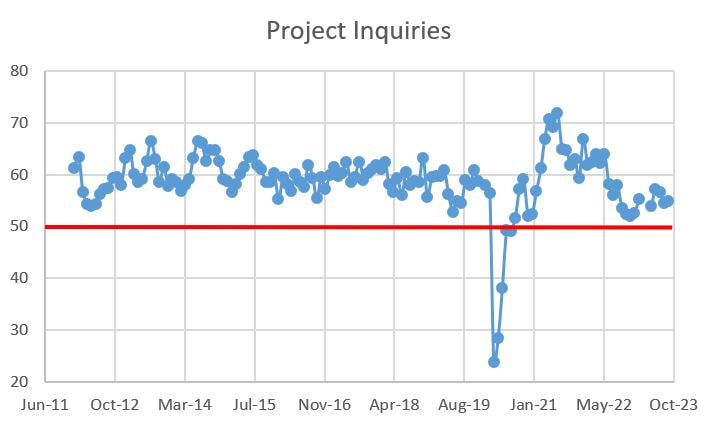
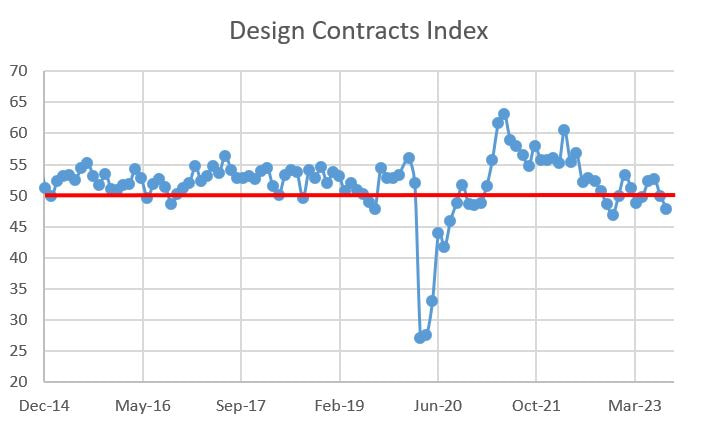
In the headline news, it is hard to find the silver linings. While those of us in the architecture/engineering/construction industry feel busy, things seem to be slowing and the Architectural Billings Index (ABI), published by the American Institute of Architects, slipped below 50, clocking in at 48.1 for August. ABI measures above 50 indicating that billings are increasing and those below 50 signaling a decrease. The ABI is a nine-to-twelve-month leading indicator of building construction activity. At this rate, contractors should expect things to start slowing down (more on that later this week). The ABI is down 9.8% over the past year and has been below 50 for seven of the past 11 months. Not great. The major question is there enough current work for contractors to remain busy and/or will federal investments re-prime the pump. The news is not all bad. Some subsectors demonstrated gains. The Northeast has climbed from negative to positive and the Commercial/Industrial segment is also north of 50, albeit declining month-over-month. All-in-all, a lot of declines in the table below. After years of heated activity, it is clear that the Multi-family Residential sector is ebbing, down an astounding 15.2% over the past year. Yikes. One other tiny speck of good news is that Project Inquiries increased slightly. That means there are still people kicking the tires on some possible project designs. More details follow.
|
Archives
January 2024
Categories |
 RSS Feed