|
2023 was not a great year from a design standpoint. For perspective, the design community cratered during the COVID-19 pandemic, only to rip north in February 2021 and continue with a full head of steam through the fall of 2021. After a minor lull in the winter of 2021, billings rocketed upwards through spring and summer 2022. And then came 2023. It wasn't an entirely bad year, but nine of 12 months of architecture billings shrank, as measured by the American Institute of Architects (AIA) Architectural Billings Index (ABI). The ABI hinges on a handle of 50; values greater than 50 mean architecture billings are increasing, while values less than 50 mean billings are shrinking. There was a lot shrinking in 2023, bottoming out with a 44.3 reading in October. The sub-50 results continued through the new year, which leads us to the present. The ABI for February 2024 came in at 49.5, which is also below the magical 50 threshold. That said, there is a silver lining: the month-over-month results show some green shoots after a dismal 2023. Look at the sharp increase in ABI from January to February below. 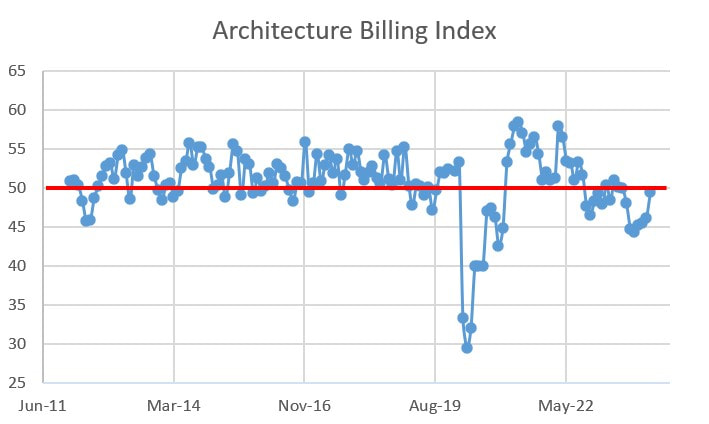 2The ABI is a leading indicator, by nine to 10 months, for construction activity. While I have a west coast bias, everyone I talk to is busy, from architects to specialty contractors. While 2023 seems to be a year of contractions, I'm guessing it was a period where the entire architecture/engineering/contractor industry was dealing with the indigestion of the post-COVID craziness. That is my guess as to why the month-over-month results show a 180-degree turn from the year-over-year values displayed below. 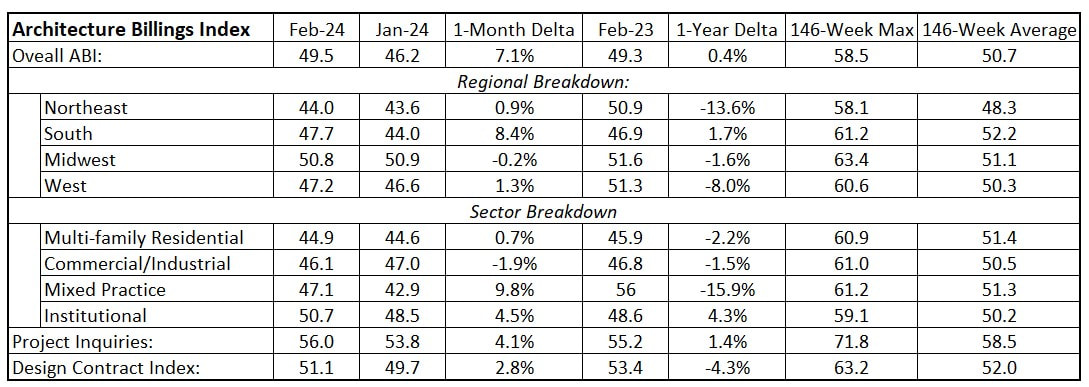 I am cautiously optimistic that 2024 will be strong in terms of architecture billings. Predictably given the level of federal funding, the Institutional market looks healthy and everything but the Midwest and Commercial/Industrial markets increased. Perhaps the worm is turning and the market will increase in strength. With the Federal Reserve Bank restating its position on three interest rate decreases in 2024, I suspect that will be a tailwind that will spur building activity. Geographic, building type, contract and inquiry details are below. 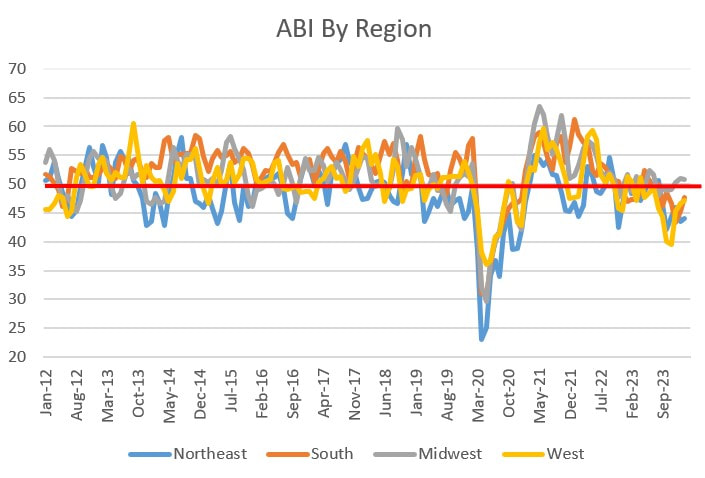 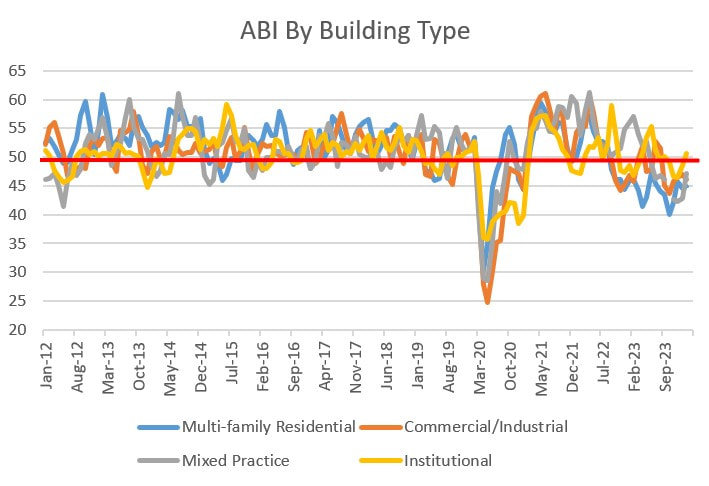 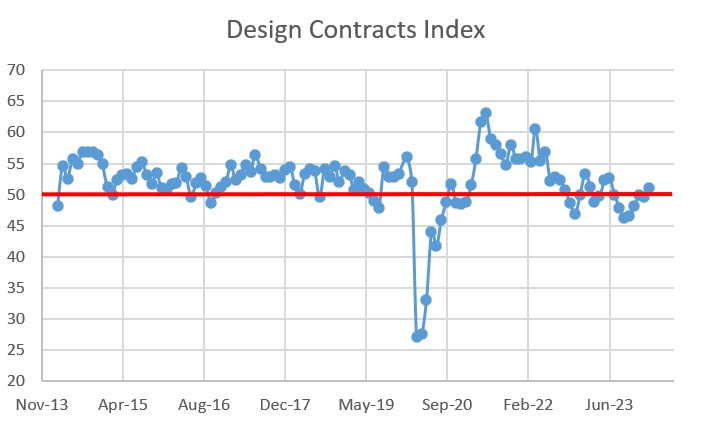 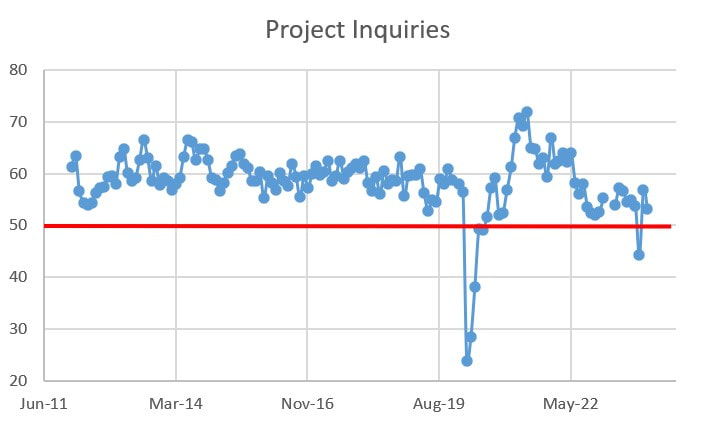
0 Comments
It has been a few months since I reported on architecture billings or contractor backlogs, and I kind of wish I remained in hibernation. While 2023 started off well enough, design activity turned sour around July. It is not all bad news, though. Contractor backlogs held steadier throughout the year, albeit with a dip in Q4. While this is predictable given the Fed Funds Rate increases, which were fully intended to pump the breaks on an overheated AEC industry, I didn't expect the design slowdown to happen so quickly or sharply. Using the data published by the American Institute of Architects in the form of the Architectural Billings Index (ABI), we can see how design activity has slipped in the second half of the year to levels not experienced since we crawled out of the COVID pit of doom. That is the bad news. The good news is that the last two readings have signaled a slight rebound. Again, this slowdown may be the industry coming to terms with the Fed Rate, which I have discussed recently. It is important to repeat that the ABI is a leading indicator of construction activity by nine to 12 months, so it foreshadows how busy contractors will be. 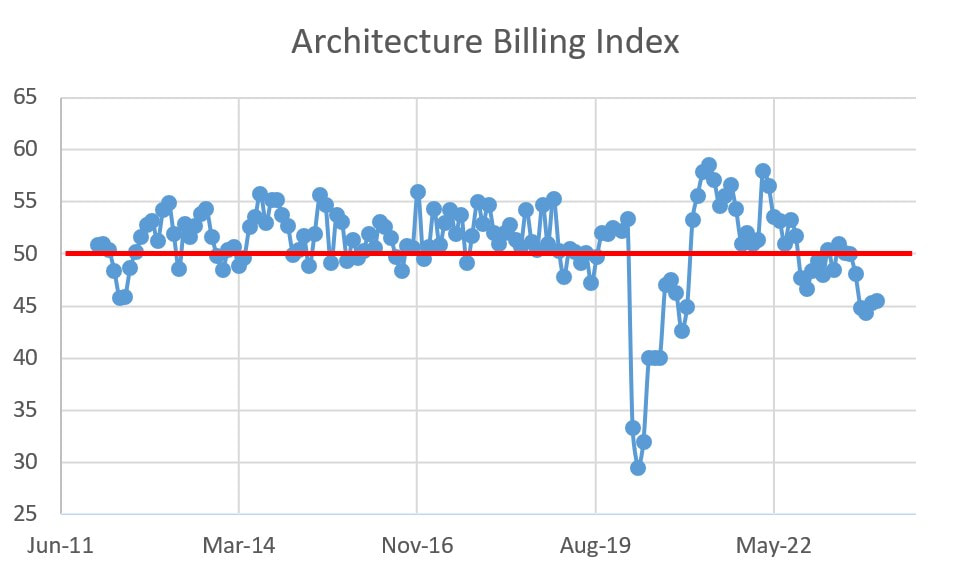 The data for the entire year is a bit manic. In spite of poor performance over the past six months, the month-over-month data is not too shabby. The South, long the darling of construction activity, was the only truly poor performer, and its cooling period was over the entire year. Aside from that, only Mixed Practice performed poorly year-over-year. Those two sub indices weighed heavily on the overall ABI, which declined 6% over 2023. All indices are below the 144-week averages and way below their highs. 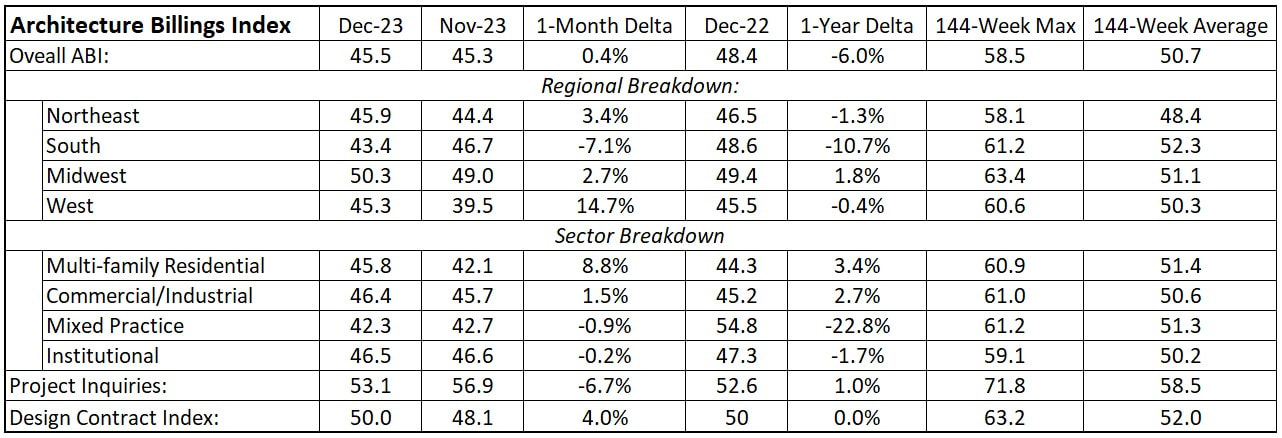 The finer details are articulated below in the other sub indices. Institutional design is weathering the storm better than most sectors and that is not completely surprising given government investment in infrastructure. That leads us to contractor backlogs. Using the Construction Backlog Indicator (CBI) index published by the Associated Builders and Contractors, we can determine in the here-and-now of how busy contractors are. Backlogs measure how much work contractors have banked. In the case of the data presented below, it represents how many months a contractor would stay busy without securing any additional work. When backlogs are high, contractors are relatively busy and have pricing power. When backlogs slip, contractors have less work lined up and, thus, lose pricing power. Overall backlogs have slipped over the last quarter of 2023, however they are still above the 59 month average. Additionally, many of the sub indices are up month-over-month. The year-over-year story is a bit different, with the overall backlog index down 6.5% and some big sub index losses, including Infrastructure (-21%), the Northeast (-10%) and contractors with $30 to $50 million in revenues (-15%) and those with revenues grater than $100 million (-25%). 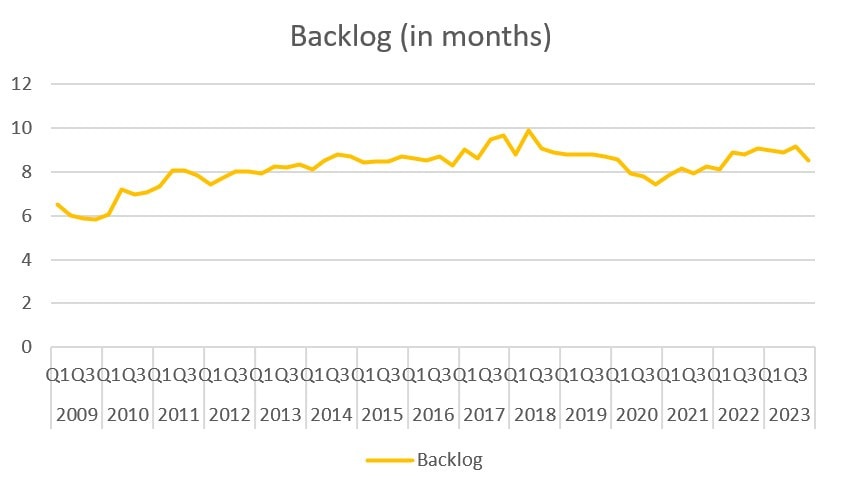 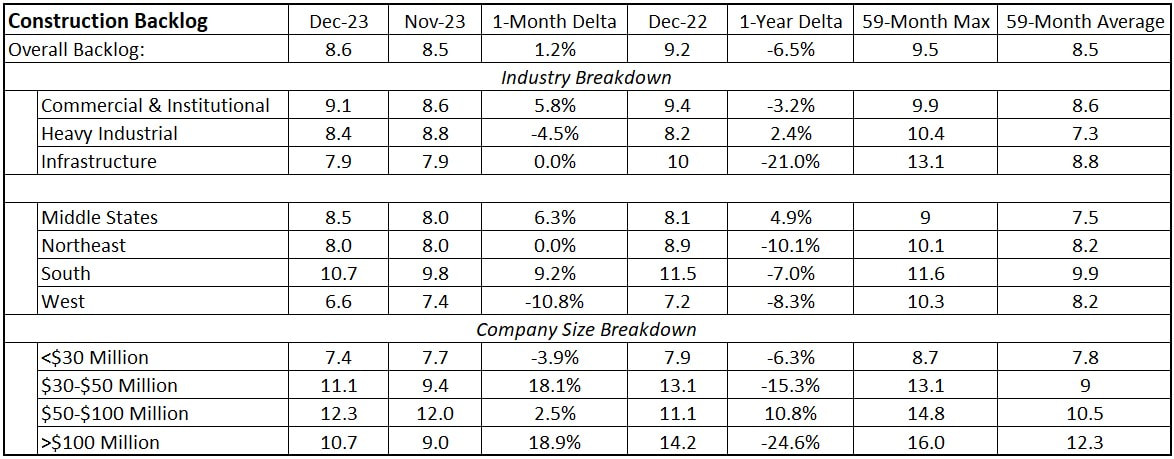 Based on the shape of the graphs (and giving grace to the differences in scales), it is clear that backlogs are less volatile that ABI. That said, in a perfect world, increasing ABI would be a catalyst for increasing backlogs, albeit with a nine to 12 month (give or take) lag. That said, given that the ABI started to struggle about six months ago, I would expect backlogs to continue their slipping over the first half of 2024. The light at the end of the tunnel is that the Fed is giving strong signals that it will decrease the Fed Rate in the second half of 2024. If the Fed handled the interest rate lever correctly, and there is strong evidence that it has shown great dexterity in cooling the economy without driving into the recession ditch, then the second half of 2024 may see increased design activity and the ABI rip north. The Cost of Capital for Engineering-Construction Firms Dropped In Spite of Rising Fed Rate1/15/2024 A lot has been made recently about how an increasing Federal Funds Rate is elevating interest rates in general, making it more costly to finance purchases. While that may be true for the economy in general, the cost of capital for engineering-construction firms actually decreased year-over-year while the Fed Rate increased. 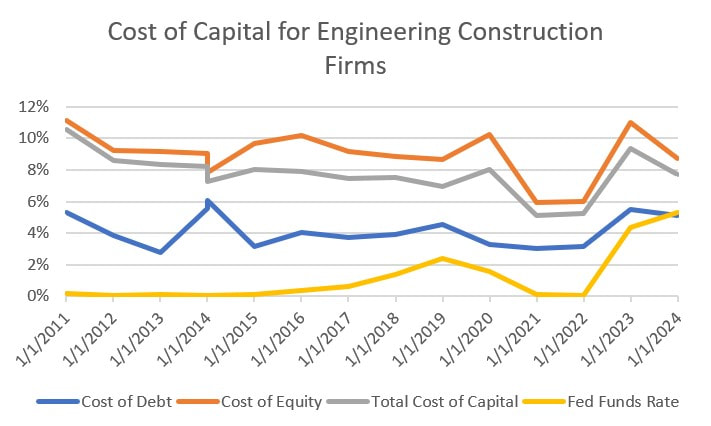 While to cost of both debt and equity lurched upward in lockstep with the Fed Rate between January 2022 and 2023, both the cost of debt and equity (and, in turn, the cost of capital) decreased between 2023 and 2024 while the Fed Rate increased. Why does this matter? Well, the cost of capital, which is a function of the cost of equity and debt, is the hurdle rate for justifying a capital investment. The higher the cost of capital, the more an investment needs to return in order to validate itself. The curve for the cost of capital mimics the Fed Rate, albeit with a 6%+ premium. One would expect that as the Fed Rate increases, so would the cost of capital. And that was the case for the previous 12 years. However, this year bucked the trend, and the costs of debt, equity and overall capital decreased even though the Fed Rate increased. This should make it easier for engineering-construction firms to invest in capital equipment, mergers and acquisitions, or other investments.
Last week, the Bureau of Labor Statistics (BLS) reported that 216,000 jobs were added to U.S. payrolls. This figure exceeded expectation and was well above the 173,000 jobs added in November. The surprise lies in that the increases in the Fed rate were intended to mute the hot job market. Job creation in the construction industry was particularly robust with the industry adding 17,000 jobs in December. While 17,000 positions was more than expected, it is in line with the average of 16,400 positions added per month in 2023 (in spite of a net loss of 9,000 jobs in March). An average of 22,000 per month construction jobs were added in 2022 (despite 4,000 construction jobs removed from the U.S. economy in January 2022). 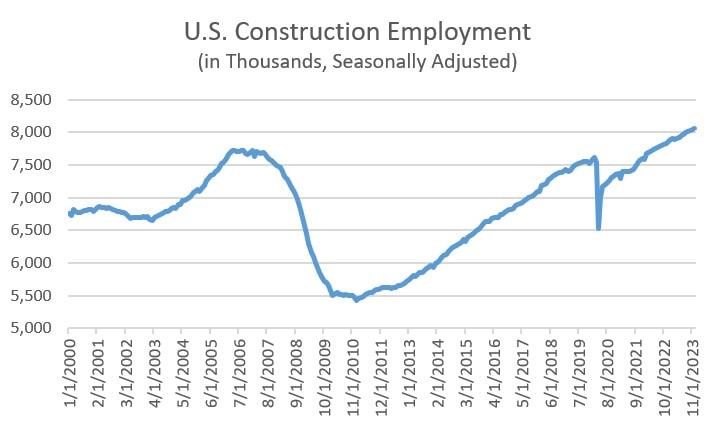 Most construction industry practitioners have been struggling to find employees for years and acutely since the market rocketed up from the COVID implosion. And the two years of gains have helped, yet we can anticipate the need for greater numbers entering the construction workforce. Total construction employment increased 2.2% in 2023, while total U.S. construction spending increased 11.4%. 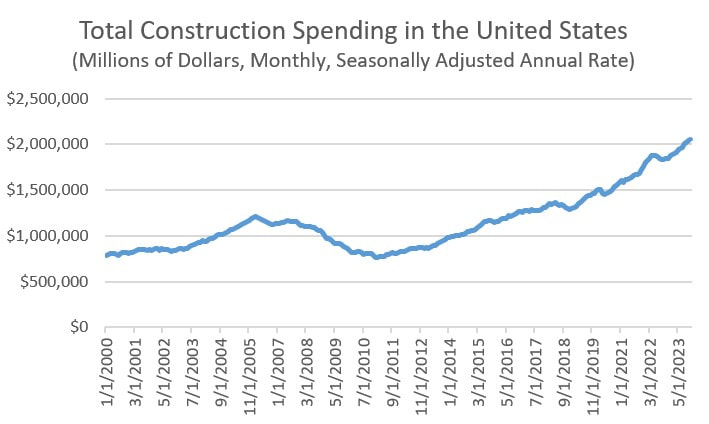 As long as construction spending continues at its current rate, which with government investments in infrastructure should be expected, we will continue to need even more people to enter the construction industry.
Yesterday I wrote about the recent declines in architectural billings, which are a nine-to-12 month leading indicator of construction activity. Since nine of 12 billing categories have declined year-over-year, now is a good time to check in with how declining billings are affecting builders. We can use my other favorite construction economic indicator, contractor backlogs, to make the determination. The most recent backlog figures, published by Associated Builders and Contractors as the Construction Backlog Indicator (CBI), in fact show a decline in backlogs. Backlog can be represented two ways. It can be measured in dollars as the amount of future work under contract or represented as the duration of time that a contractor will be busy without adding any additional work (the figures below use the latter, represented in months). In either case, it is a representation of how busy contractors are. 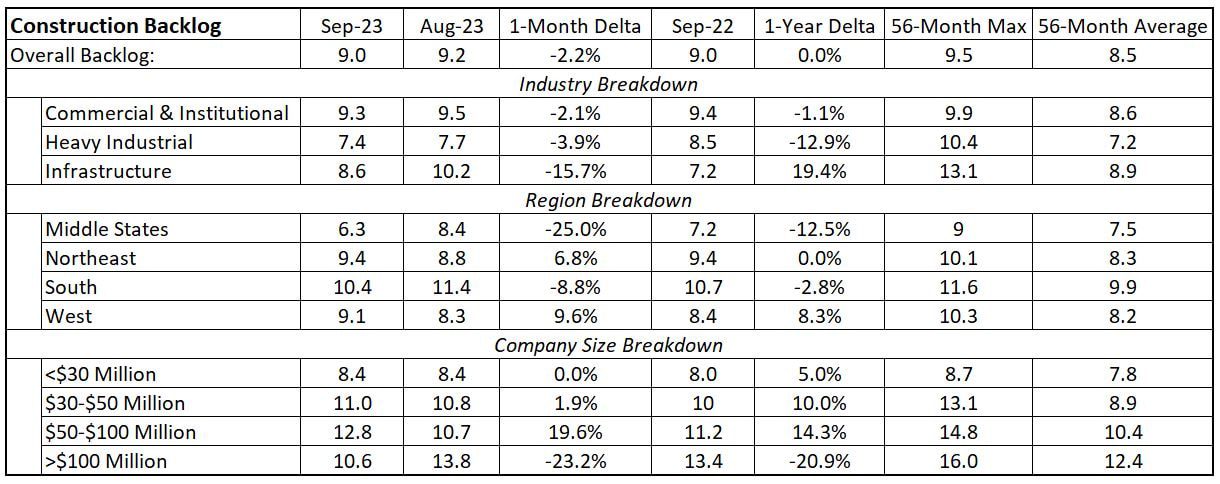 Overall, backlogs are down over the past month, yet they are breakeven year-over-year. Unlike architecture billings, the subsectors of backlog measures are a bit more mixed. While all construction sectors slid, the geographic sectors are 50/50 in terms of gainers and decliners. The Northeast is particularly interesting. After lagging most other regions for several years, architectural billings in that region are up, both month-over-month and year-over-year, while its backlogs are up and even, respectively, demonstrating relative strength. The region to watch closely is the West, which has declining billings MoM and YoY but has increasing backlogs. If billing are correlated to backlogs with a 9-12 month lag, then we would expect backlogs to start declining in the next few months. Another interesting side note are the large, double-digit declines in Infrastructure, Middle States and >$100 million contractors. There have been a lot of projects in the Midwest targeted by the recent Federal infrastructure investments, yet the data states otherwise. Perhaps it is too soon for the funds to represent actual construction activity. One last side note is that while overall backlogs have declined and some subsectors have declined precipitously, most contractors I speak with are still really busy. That is to to say that the industry is not slowing, yet it really feels, at least for the time being, that the industry is no longer crazy busy. The Federal Reserve Board has been trying to gently slow the economy by raising the Fed rate, so hopefully any future declines in backlogs are measured and help normalize construction costs. Historical backlog data is shown in the below graphs. 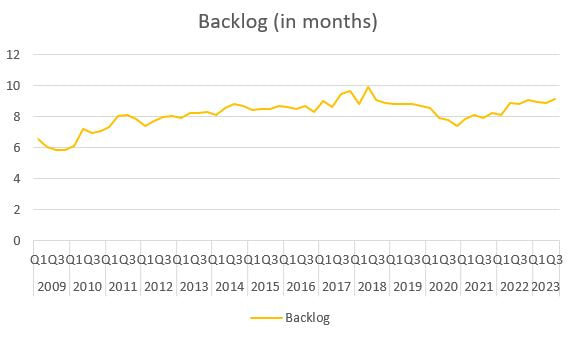 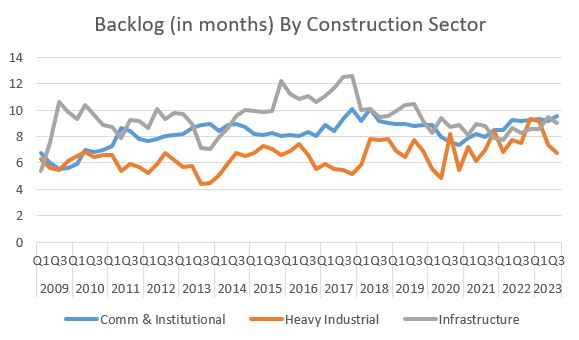 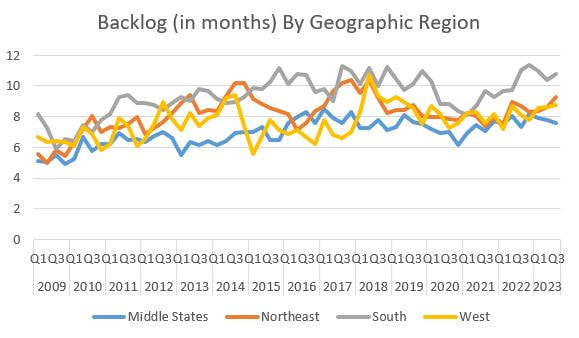 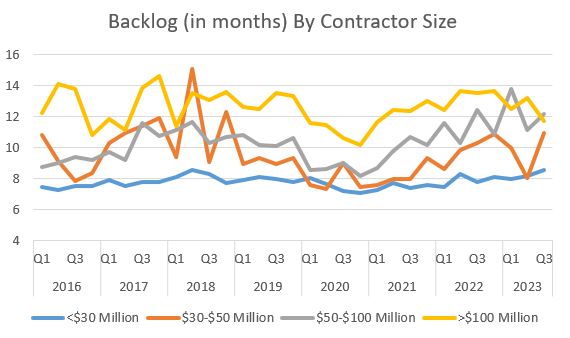 In the headline news, it is hard to find the silver linings. While those of us in the architecture/engineering/construction industry feel busy, things seem to be slowing and the Architectural Billings Index (ABI), published by the American Institute of Architects, slipped below 50, clocking in at 48.1 for August. ABI measures above 50 indicating that billings are increasing and those below 50 signaling a decrease. The ABI is a nine-to-twelve-month leading indicator of building construction activity. At this rate, contractors should expect things to start slowing down (more on that later this week). 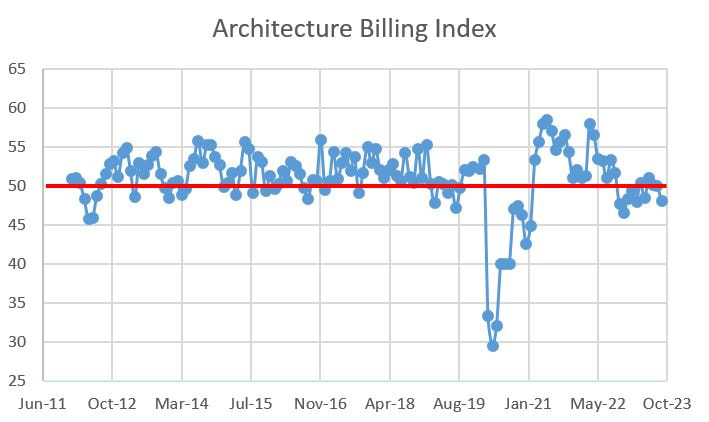 The ABI is down 9.8% over the past year and has been below 50 for seven of the past 11 months. Not great. The major question is there enough current work for contractors to remain busy and/or will federal investments re-prime the pump. The news is not all bad. Some subsectors demonstrated gains. The Northeast has climbed from negative to positive and the Commercial/Industrial segment is also north of 50, albeit declining month-over-month. All-in-all, a lot of declines in the table below. After years of heated activity, it is clear that the Multi-family Residential sector is ebbing, down an astounding 15.2% over the past year. Yikes. 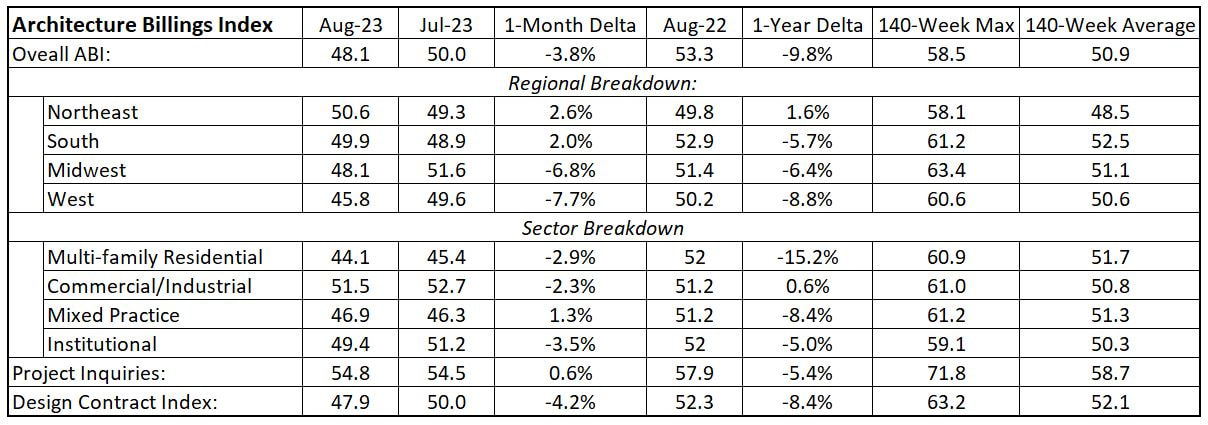 One other tiny speck of good news is that Project Inquiries increased slightly. That means there are still people kicking the tires on some possible project designs. More details follow. 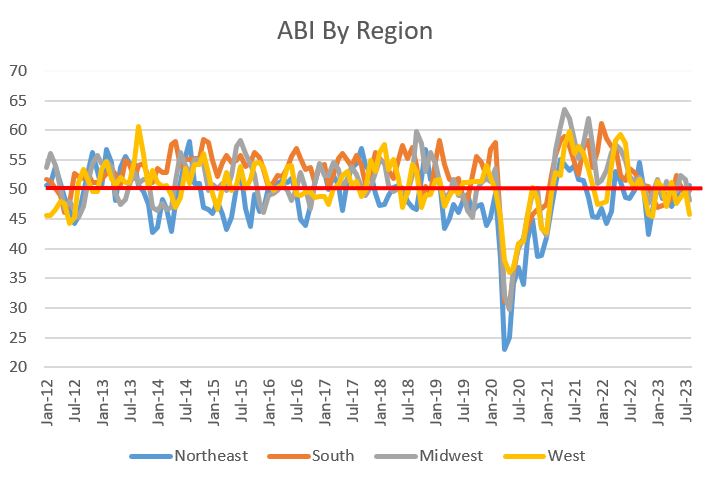 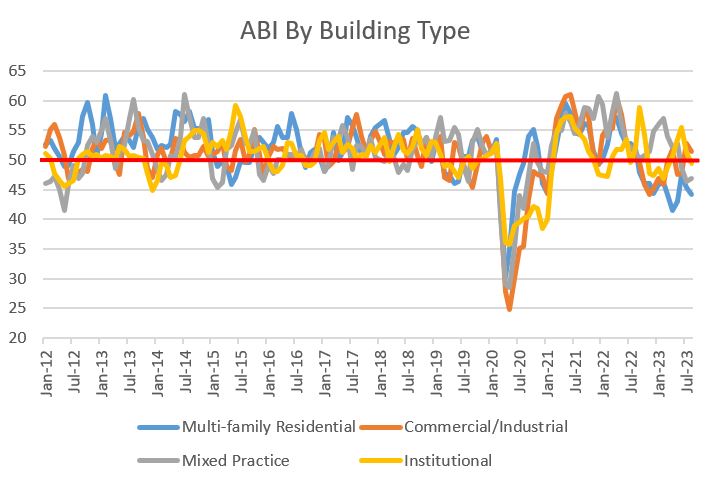 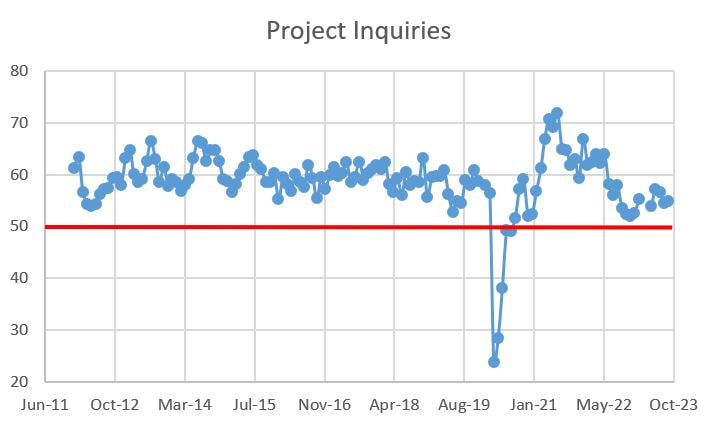 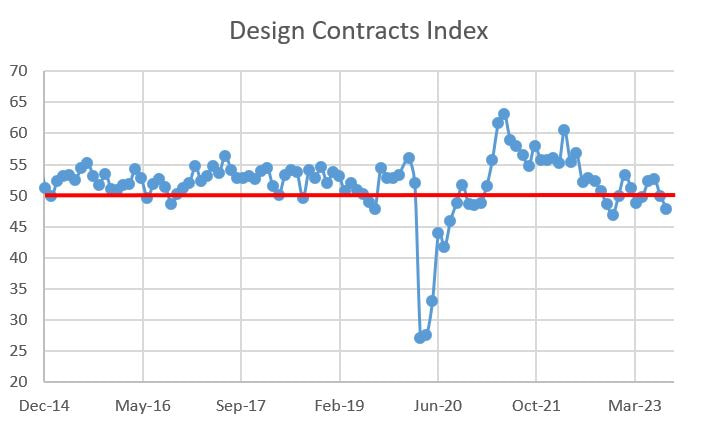 We are in strange times. The Federal Reserve Bank is increasing the effective fed rate in an effort to cool inflation, which is a response to a hot market. And yet demand persists. People keep spending money on houses (if they can find one), cars, COVID revenge travel, etc. Where is our pain threshold? How high do interests need to go before the market taps out? While one data point does not define a trend, the most recent report on Architectural Billings Index (ABI) published by the American Institute of Architects, delivered a 50 handle. The ABI is a nine-to-twelve-month leading indicator of building construction activity, with ABI measures above 50 indicating that billings are increasing and those below 50 signaling a decreasing billings. So July's reading is neither going up nor down. Is this the breaking point? 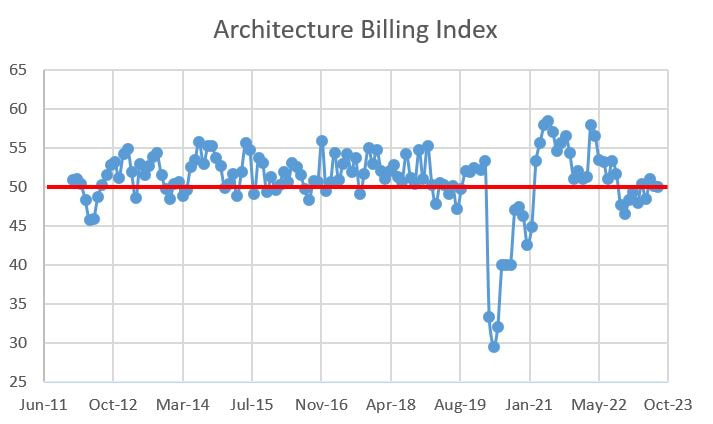 The details show a more mixed picture. The Midwest has increasing billings, while the other geographic areas are down. In terms of product, Commercial/Industrial and Institutional are up while Multi-family and Mixed Practice are cratering. Project inquiries, a measure of people planning projects for the future, is above solidly above 50, but it is way below the average for the past 11 years. Good news plus bad news equals break even. 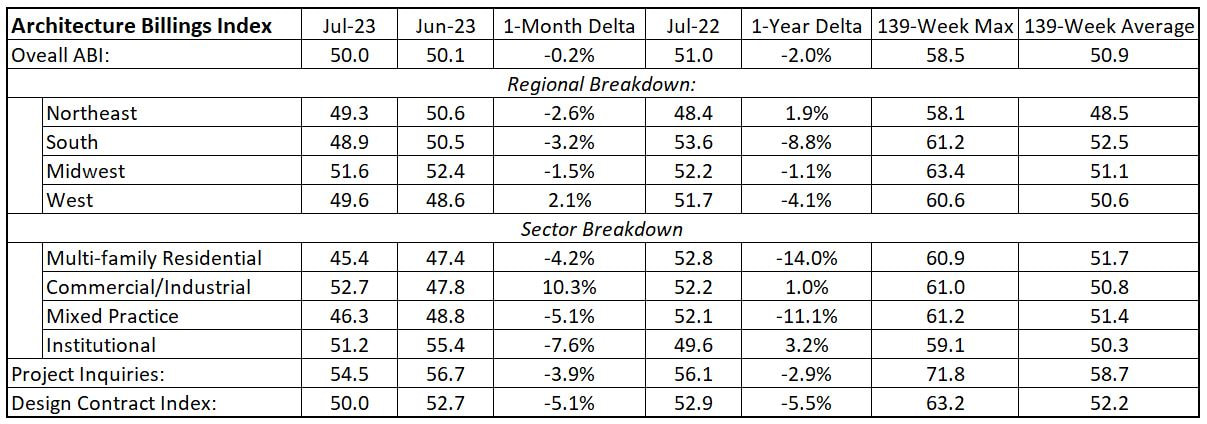 The next few months will be very revealing. While the Fed indicated a week ago that they are done hiking rates for the near term, it is maintaining optionality to increase funds later this year. Which is Latin for they are waiting for more info before making a definitive call. Just like the rest of us. Until then, hold on tight. The details follow: 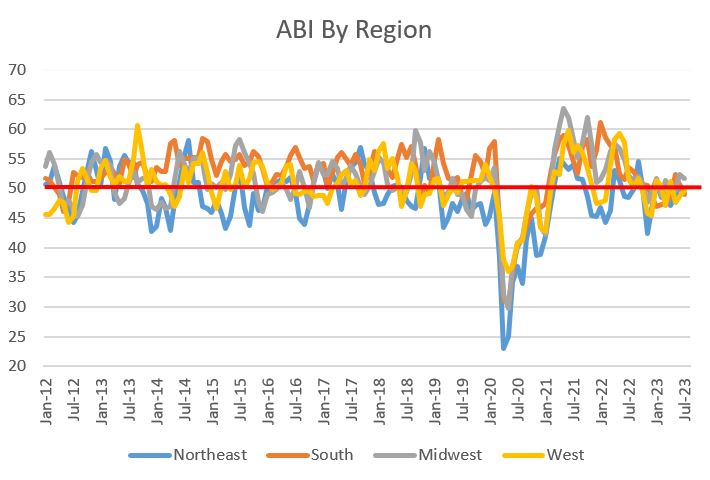 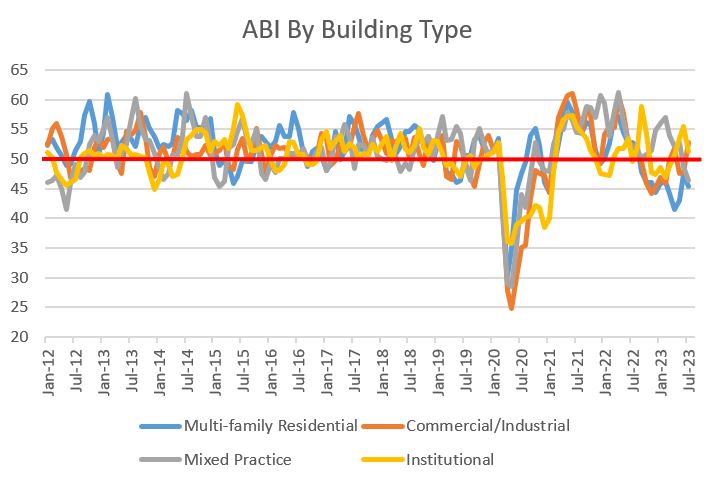 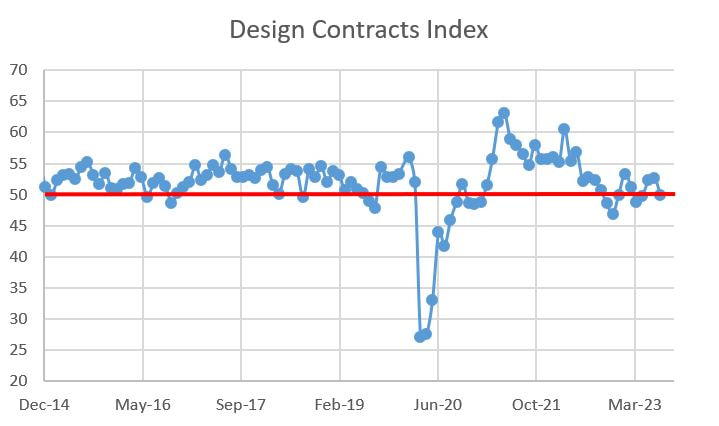  For as long as I have been analyzing construction economic data, I have been fascinated by backlog. Backlog, expressed in dollars, is the amount of work companies are contracted to perform in the future. Backlog can also be expressed in time (typically months) as the amount of work that would keep a contractor busy if no other contracts were executed. Essentially, it is a measure of how busy contractors are. The Associated Builders and Contractors (ABC) tracks backlog and reports it monthly and their methodology can be found here. Backlog is important, because it is a proxy for a contractor’s near-term economic health. If a company has a strong backlog, it can either be more selective about the additional work it pursues and/or increase its proposed fee on the work it pursues. If fees increase, profit, in theory, should also increase. On the flipside, a relatively small backlog indicates weakness, implying contractors must chase work more aggressively, typically eroding profitability. Given that backlog is used to gauge an architecture/engineering/construction (AEC) company’s economic health, it would make sense that people with an economic interest in an AEC company would want to know the backlog to help determine if they should hold or sell their investment. Sure enough, for companies that must report financial performance, chiefly firms that are publicly traded on major U.S. stock exchanges, they do tend to highlight their backlog as an indicator of future performance. There are not that many publicly-traded AEC firms, but in the construction financial press, AECOM, Fluor Corporation, Granite Construction Inc., Jacobs, and Tutor Perini, prominently report their increasing backlogs. Whether the financial reports are good, bad or ugly, backlogs are typically featured prominently to magnify good news and deflect bad news. Think I am being cynical? Check out the press releases from this recent quarter:
My curiosity having been piqued, I wanted to use publicly-available financial data to see if there is a simple link between backlog and profitability. Hoping to avoid performing a linear regression to determine any causality, I will compare the financial performance of the five previously-mentioned firms from the most recent quarter to the corresponding quarter 10 years prior. (That sentence was not completely correct…I actually really want to perform a linear regression as it will scratch my nerd itch. But given a lack of time, I’m hoping to catch lightning in a bottle with an incredibly basic analysis.) Before diving into the results, keep in mind that total construction spending in the United States increased from $ 2,784,938 million in the third quarter of 2013 to $ 5,772,918 million in the second quarter of 2023 (10 years total), and increase of 107.3%. Over that same period, the United States Gross Domestic Product (GDP) increased from $ 16,911,000 million to $26,834,001 million, or 58.7% increase (yeah, those are really large numbers). We want to normalize the five AEC companies’ results against a raising U.S. economy over those 10 years, as revenues and backlog should catch a tailwind and grow as the U.S. economy grows. 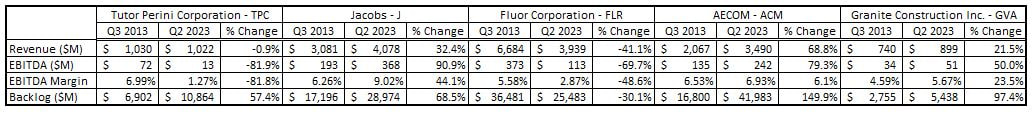 The figure above is comically small, so I will summarize it in bullet points:
Based on connecting two reporting periods ten years apart, there does not seem to be a strong link between backlog growth and profitability. There are a lot of holes in the analysis, chiefly:
While not pure-play contracting entities, the companies analyzed above are AEC industry bellwethers. I would greatly like to add some publicly construction companies to the database, namely Skanska and Balfour Beatty, but they are listed on European exchanges and thus have different reporting requirements (different measure of profitability), so that will take some time. As for more in depth data analysis, it looks like my next move is a linear regression. Stay tuned for those results. Until then, there is no obvious correlation between increasing backlog and increasing profitability based on this basic analysis. In a previous post I showed how architectural billings, a leading indicator of construction activity, has been very up-and-down since early 2021 after rocketing upwards from a pandemic-induced crater. In theory, contractor activity should similarly move similarly lagging by nine to 12 months. But that has not happened. Backlogs have steadily moved upwards since the tail end of 2021. Given that increasing backlogs are a proxy for how busy contractors are (and by extension, if backlogs increase, so should contractor pricing power, leading to higher fees), this is positive news that outperforms the AIA ABI expectations. 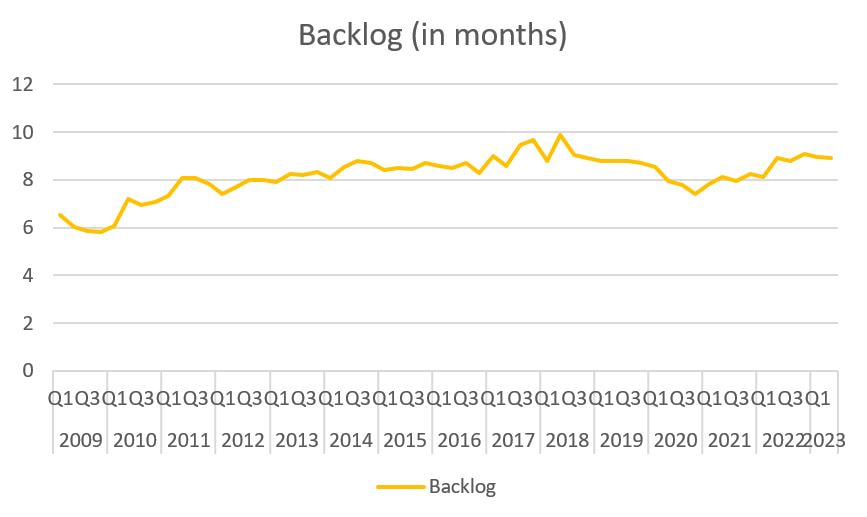 The above curve plots the average backlog by quarter, so the curve is smoothed. If we drill down into the month-over-month data, it reveals more, albeit mild, volatility. Overall backlogs are unchanged from May, but drilling into the industry breakdown shows some randomness, with Heavy Industrial down big but Infrastructure up even bigger (Federal infrastructure bills perhaps? Infrastructure is up over 40% year-over-year). The story is similar for regional and company size breakdowns. 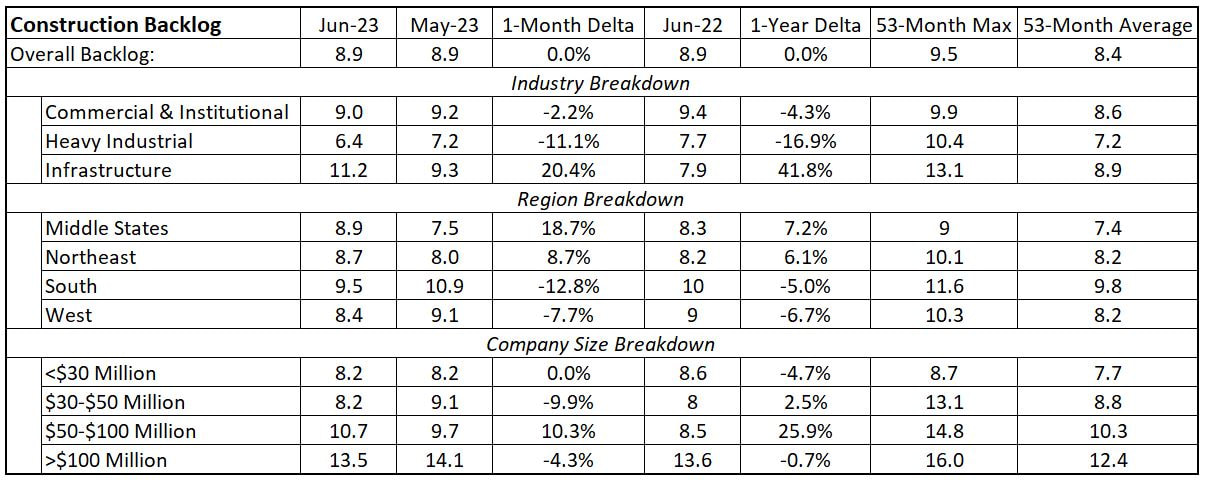 The reductive hot take is that it is a good time to be a $50-100 million per year contractor performing infrastructure work in the northeast and midwest markets. More detailed information is below: 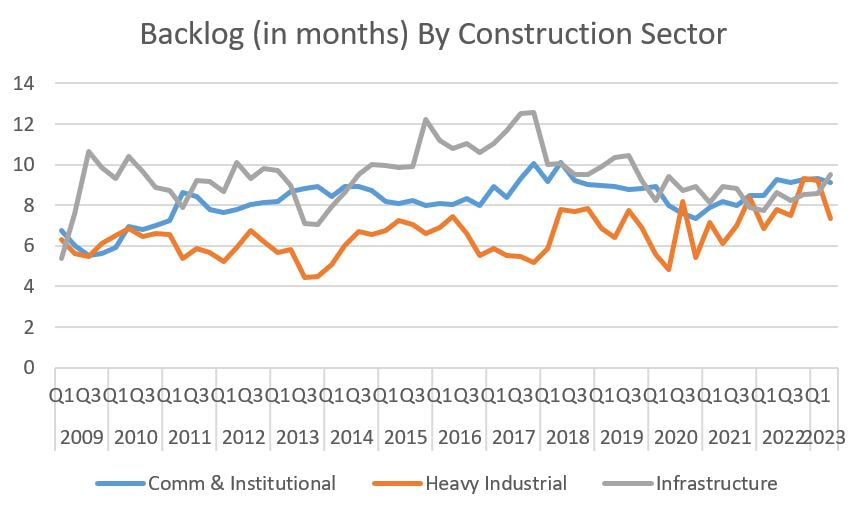 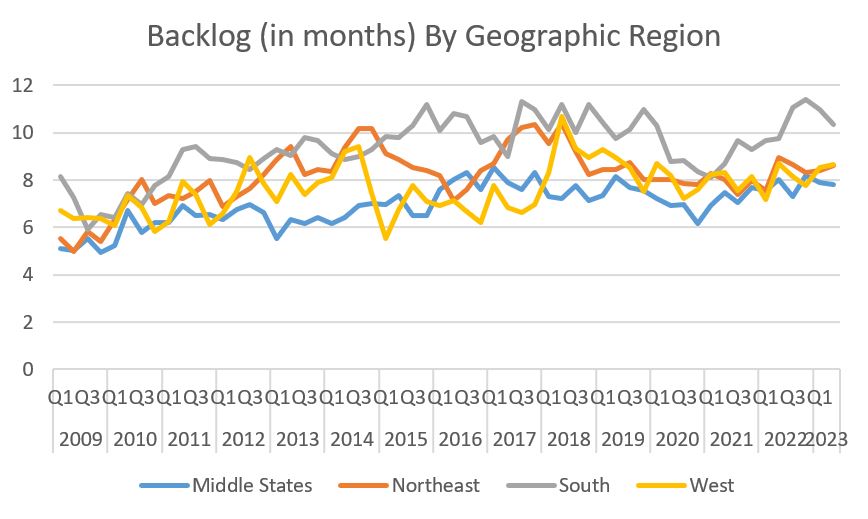 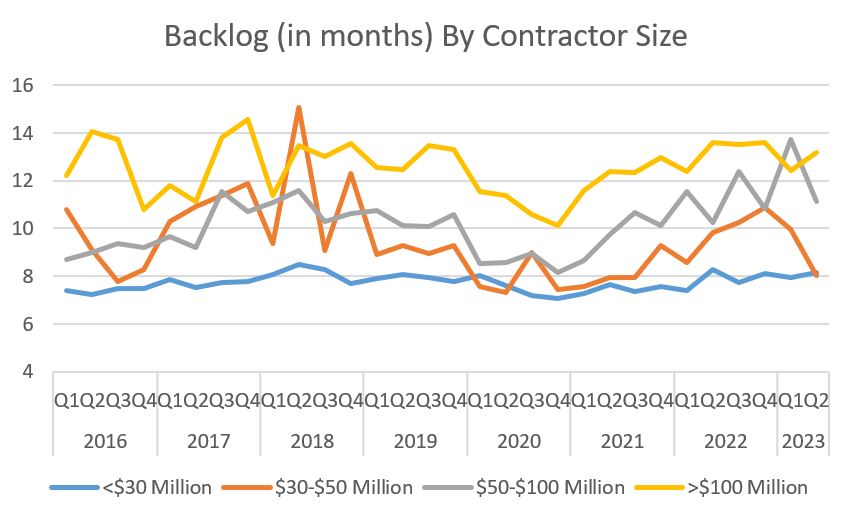 The Architecture Billings Index (ABI) as reported by the American Institute of Architects (AIA), is clinging to the increasing billings side of the ledger with a 50.1 handle for June. The ABI is a nine-to-twelve-month leading indicator of building construction activity, with ABI measures above 50 indicating that billings are increasing and those below 50 signaling a decreasing billings. While June's reading was down from May's 51, this is the first two-month positive streak since August/September of last year. 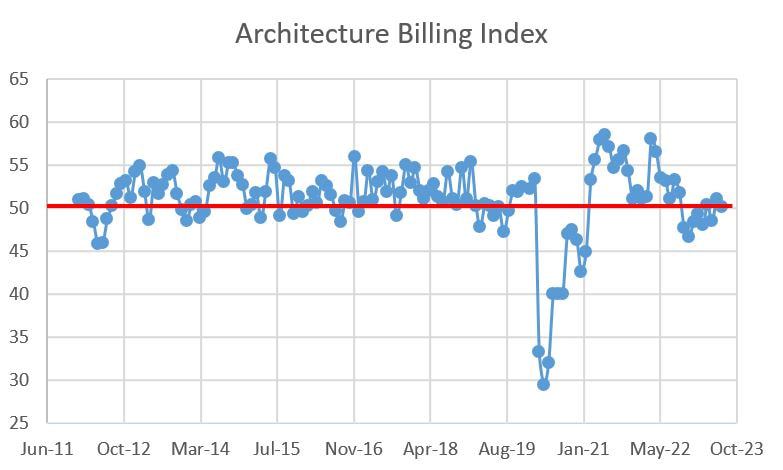 The data was largely mixed, with half of the sub measures above 50 and four of ten increasing month-over-month. Seven of ten measures are down year-over-year, with the West falling by almost 16%. 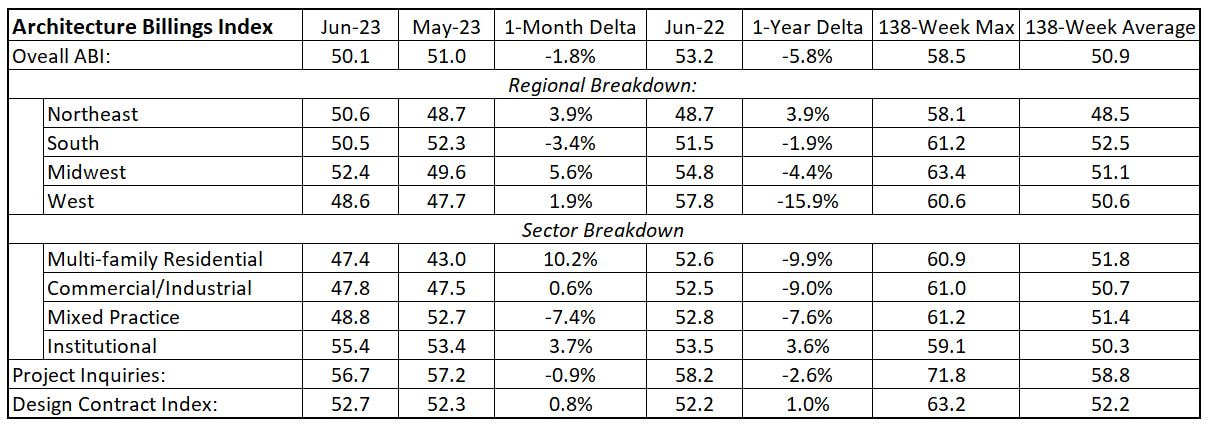 While the architecture/engineering/construction market clearly ripped up from the COVID chasm, the ABI performance has whipsawed since 2021. While the industry seems really busy, the capacity to deliver projects has been hampered by supply chain issues, lack of labor and, more recently, increasing interest rates. As long as those headwinds persist yet demand remains high, we will likely continue to experiencing seesawing ABI figures. Detailed data can be seen below: 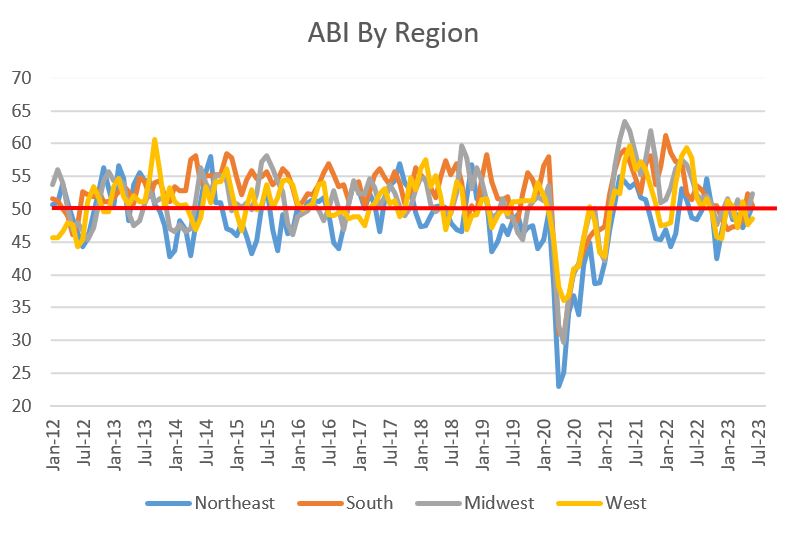 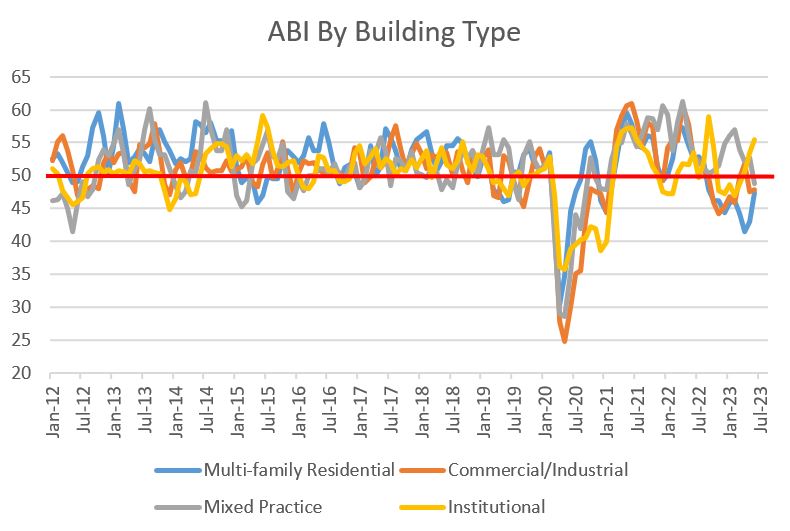 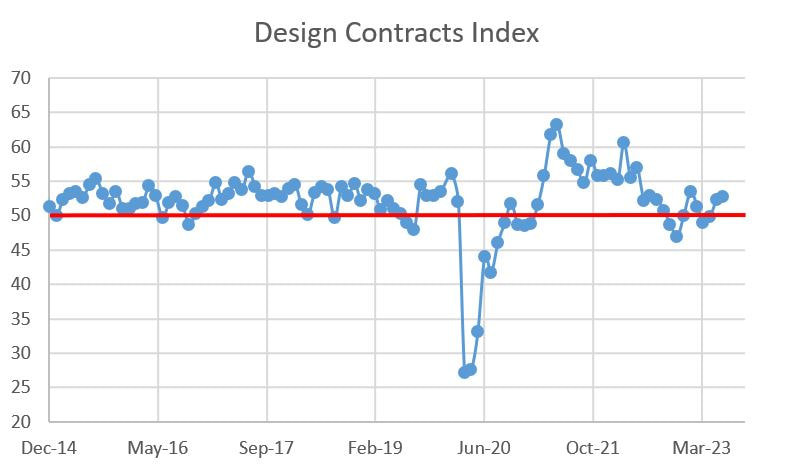 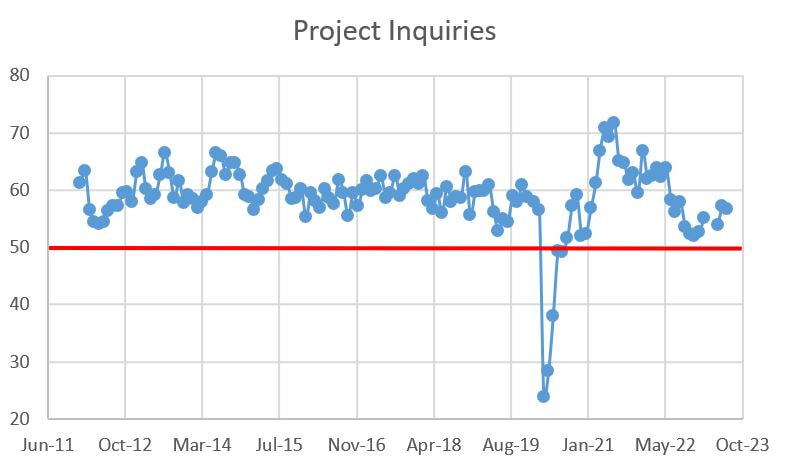 |
Archives
January 2024
Categories |
 RSS Feed