|
I read an interesting article last week that discusses how current market uncertainty has created a divide between winners and losers in the construction industry. That article was great foreshadowing for the March results of the Architecture Billings Index (ABI) as reported by the American Institute of Architects (AIA). The good news is that overall billings increased month-over-month, clocking a 50.4 handle in March, up from 48 in February. The bad news was widespread declining billings in the sub categories. Adding insult to injury, the numbers are way down on a year-over-year basis. A quick reminder that the ABI is a nine-to-twelve-month leading indicator of building construction activity, with ABI measures above 50 indicating that billings are increasing and those below 50 signaling a decreasing billings. The overall billings tend is displayed below, with March's figure peeking just above the 50 line: 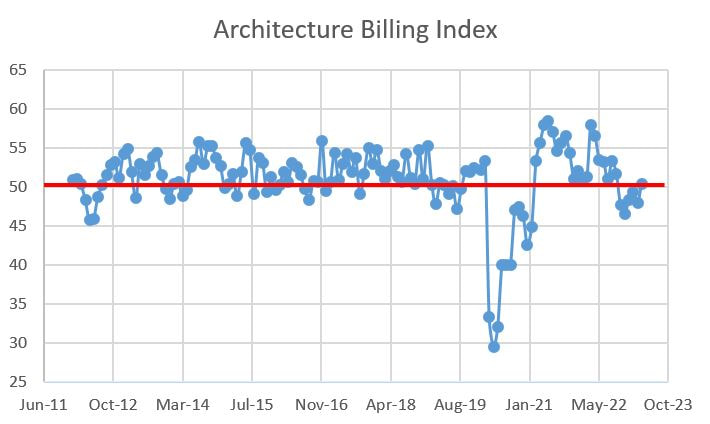 A dive into the details shows the extent of the carnage. While there were month-over-month improvements in the ABI in all geographic regions save the West and there were big sectoral gains in Commercial/Industrial and Institutional projects, only the Midwest and Mixed Practice have an increasing rate of design billings; all other sectors are decreasing. So the positive overall ABI of 50.4 is being propped up by projects in the Midwest and Mixed Practice projects. Everything else is a drag. If we zoom out and look at ABI performance over the past year, we see darker clouds. The overall ABI, as well as many sub-ABI measures, are down by double digit percentages. Multi-family, once the darling of the AEC industry and the sector that managed the COVID pandemic the best, is falling like a stone with a drop of almost 23%. It's not time to panic. With the construction market starved for labor and still finding it difficult to procure materials, having some sectors cool while others heat up will keep many contractors busy for a while. Furthermore, many of the sub ABI figures are flirting with the 50 level, meaning a few good months of future performance could turn the tide. Chances are we will just have to become comfortable with this "on the one hand, on the other hand" type of fluctuating good/bad news cycles. A lot of people watching the banking industry are wondering if lenders with a lot of commercial real estate loans on their books are the next shoes to drop in the Silicon Valley Bank/First Republic Bank failure melodrama. If weakness is revealed, I suspect the breaks will lock up on the design and construction industry. Let's hope not. Detailed regional, sectoral and contracts information is as follows: 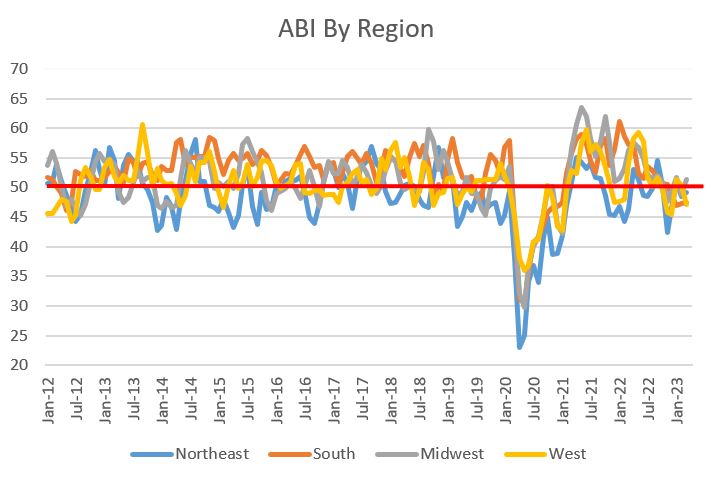 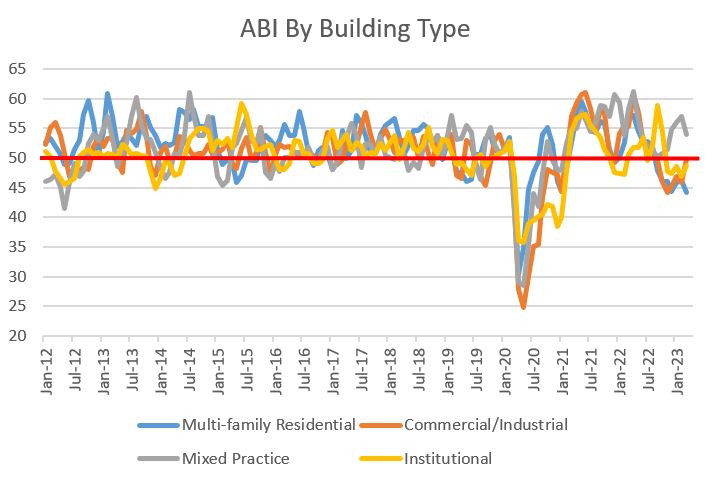 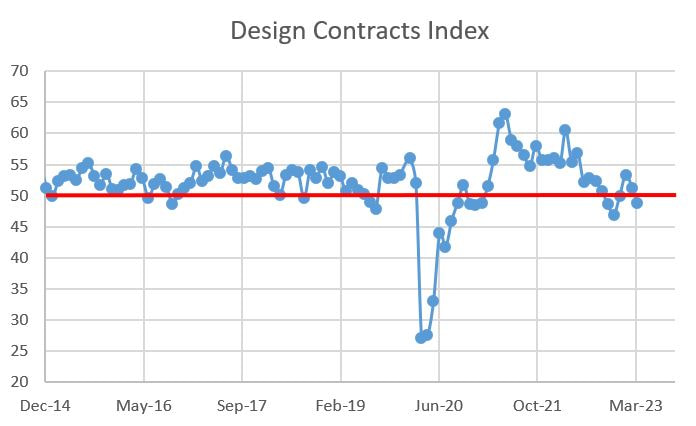
0 Comments
It has been a while since I wrote about contractor backlogs and I picked a lousy month to restart. Backlogs declined across most categories, deeply in some cases. Backlog can be represented two ways. It can be measured in dollars as the amount of future work under contract. Conversely, it can be represented as the duration of time that a contractor will be busy without adding any additional work. In either case, it is a representation of how busy contractors are, and when contractors are busy, it is a sign of a robust market and increased pricing power for contractors. Backlog will be represented below in months, and the overall industry backlog decreased from 9.2 months to 8.7 months. On a quarterly basis, backlog has moved sideways since Q2 2022. Keep in mind that backlogs have been increasing in fits and starts since bottoming out in Q4 2020 due to the COVID-19 pandemic. 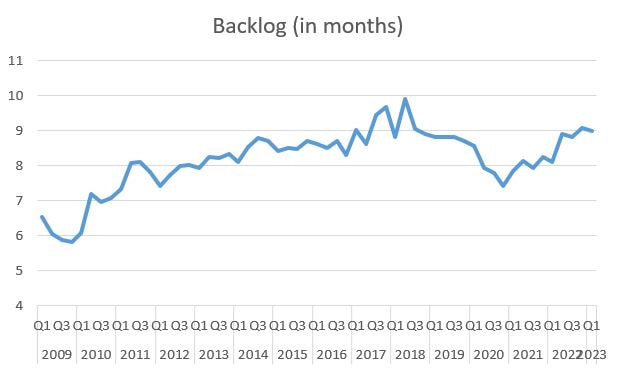 Digging into the detailed data shows widespread drops in backlog. As with most economic data, there are some pockets of good news. 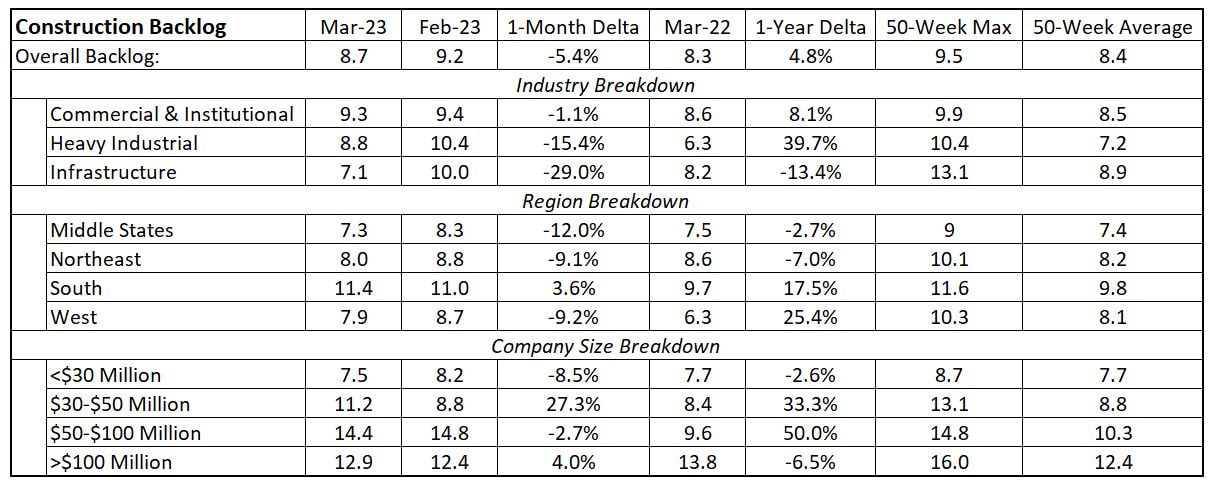 First the good news: the South remains a hot region for construction. Also, and I find this very interesting, backlogs increased for all size categories except small contractors (<$30 million in annual volume). Unfortunately, that's where the good news ends. Backlog for smaller contractors was down sharply, and the news was worse in the all regions except the South. The real pain was saved for the heavy industrial and infrastructure categories. If we zoom out to the year-over-year data, the picture is a bit better, with eight of 12 categories increasing. But the infrastructure numbers are confounding. Given all the government funding being rotated into infrastructure, I would expect backlogs to be growing. However, it may just be a while before we see infrastructure construction to increase as many projects may still be in design. We will just have to see how that category evolves over the next few years. For more details on how the data has evolved since 2009, keep scrolling. 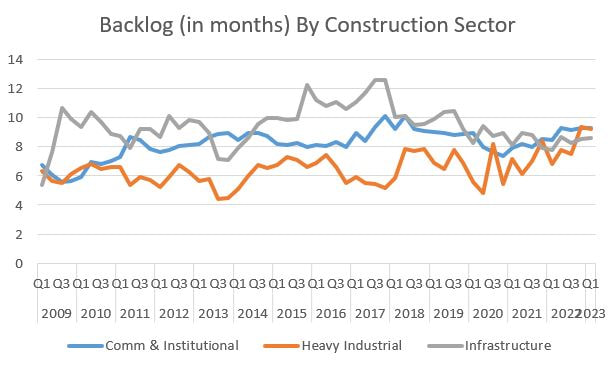 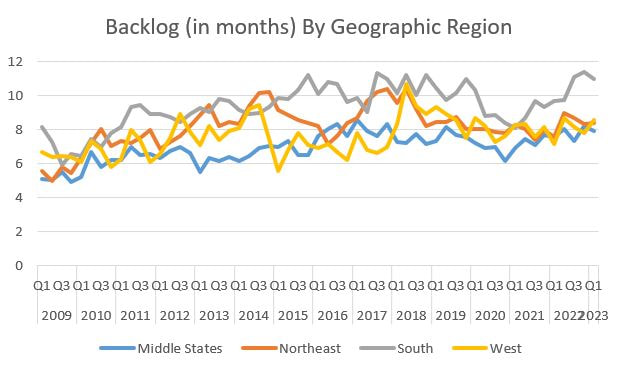 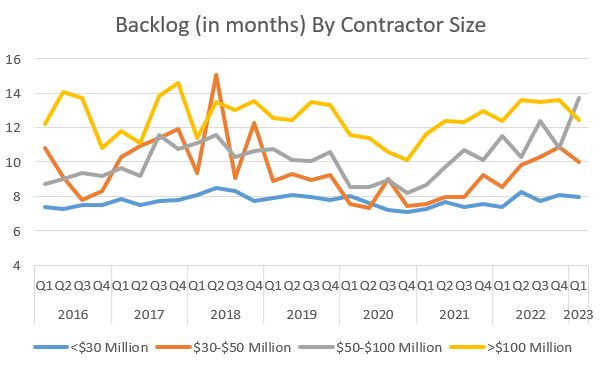 For those of you following the financial press, much of the discussion is about what moves Jay Powell his and his fellow voting board members of the Federal Reserve of the United States will do with the Federal Funds Rate. Simply stated, the Fed Funds Rate is the interest rate that depository institutions, such as banks and credit unions, lend their reserve balances to other depository institutions. The Federal Reserve is currently increasing the Fed Rate in an effort to make it more expensive to borrow money, and hence, more costly to finance goods (both personal and business). The Fed is doing this to purposefully cool the economy to tame inflation. The construction industry is highly dependent on credit. (In the simplest terms that deserve their own post, most construction companies need to borrow money to complete projects due to cash flow challenges created by the mismatch between project expenditures and progress payments received. Also, the construction industry is equipment dependent, much of which is financed.) So if the Fed is increasing the Fed Rate, and by association the cost of borrowing, what is happening to the cost of capital for players in the construction industry? Does the construction industry cost of capital increase similarly as the Fed Rate? The answer is yes. Before revealing the data, some background. The cost of capital being used is the weighted cost of capital (WACC) based on a company's blend capital sources, chiefly common stock equity, preferred stock equity and bonds. Equity is most often associated with public companies and the data represented is for publicly-traded companies (as provided by Prof. Aswath Damodaran of the NYU Stern School of Business). The overwhelming majority of construction companies are not publicly-traded. Most are privately-owned small businesses, so that is a weakness of the data below in terms of applying it to the entire construction industry. But publicly-traded companies must report their finances, so that is the available data. All that being stated, below are the WACC for engineering-construction companies and building materials companies compared to the Fed Rate. 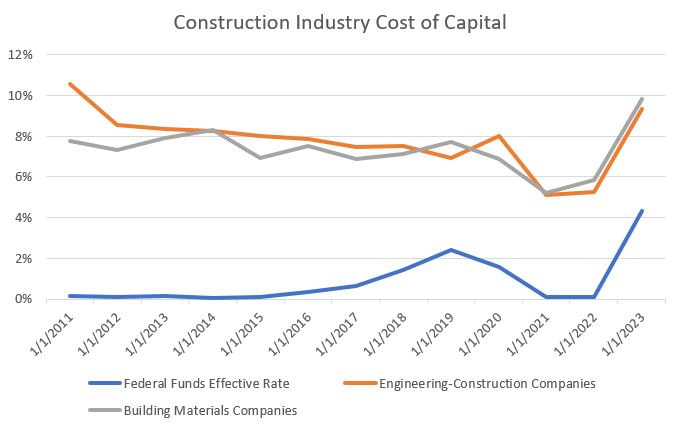 The Fed Rate was effectively zero for an entire year (2021 to 2022) and then increased sharply to 4.33% in January 2023. It is currently 4.75% and was predicted to go higher at the next Fed board meeting until Silicon Valley Bank went sideways (due in part to its inability to manage the increasing Fed Rate unlike every other bank save one, Signature Bank in New York, which also recently failed). The WACC were 5.1% and 5.2% for engineering-construction companies and building material suppliers, respectively, in January 2021. The both moved sharply upwards, in lock step with the Fed Rate to 9.34% for engineering-construction and 9.82% for materials in January 2023. So what does this mean? Aside from a higher WACC cooling the economy (higher WACC means a higher cost of construction), there are other knock-on effects. In recent years, many large construction companies have been engaging in mergers and acquisitions. M&A takes many forms in the construction industry, from one firm buying another or a division of another (e.g. Pearce Renewables buying Mortenson Renewables), specialty contractors buying companies to broaden scope (e.g. an electrical contractor buying a mechanical contracting company to become a "super sub"), a general contractor forward integrating by purchasing or investing in a self-perform division (a GC buying a company or the equipment to self-perform concrete) or a contractor backwards-integrating into the supply chain to buy a material provider (a company that self-performs framing buying or investing in a company that provides cross-laminated timber). In order to make these types of company (or division) acquisitions or investments in new lines of business takes capital. The more expensive the WACC is, the harder it is to finance acquisitions. And the increasing cost of capital for engineering-construction and building supply companies is correlated with reduced M&A transactions, both in number and in aggregate value (data from Refinitiv). 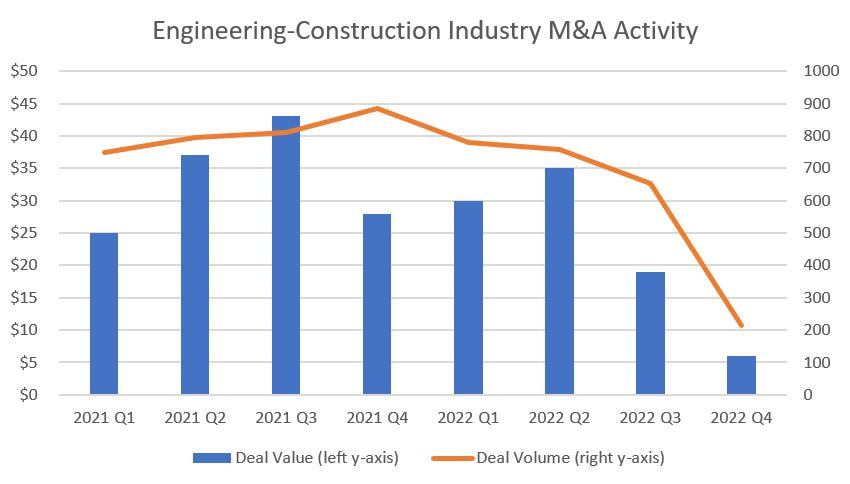 Correlation is not causation, but it is tough to ignore the connection between increasing WACC and reduced M&A activity. These trends are consistent across other industries as well.
I suspect we will see less expansion of companies (opening additional offices in new geographic locations), contractors focusing deeper on their true strengths rather than diversifying into adjacent business lines, and focusing on supplies or installation but less of doing both. As the economy contracts, builders will stick to what they do best to maintain their highest profit potential. Construction Labor Costs are Rising, but Not Even Close to Increase in Material Price Increases3/29/2023 I read an article today stating that construction employment is up in 45 states last month. Given how busy the construction market is, and should in theory continue to be with government investments in infrastructure, this makes complete sense. Then I went down the rabbit hole: many of the projects we have put out to bid or proposal recently have been coming in at costs higher than expected. Is this due to increasing labor and/or material pricing? The short answer is both, but one in particular. The supply chain issues since the onset of the COVID-19 pandemic have been well articulated and continue to present times. The lack of labor, due to double whammy of fewer people entering the trades and a mass retirement of people on the tail end of their careers, is also a well know problem. So going further down the rabbit hole, which one is more acutely leading the the increasing cost of construction? It turns out materials pricing has the bigger lever. 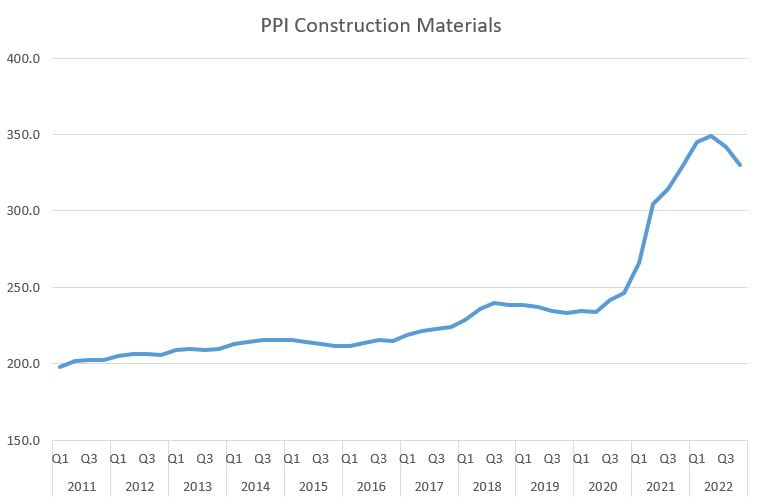 While declining 5% since the first quarter of 2022, construction material prices, as measured by the Producer Price Index for Construction Materials, are up over 40% since starting a skyward upward trend in the second quarter of 2020. Keep in mind, the y-axis is relative, with 1982 being pegged at 100. Labor costs are also up recently, but the increase is much more subtle. 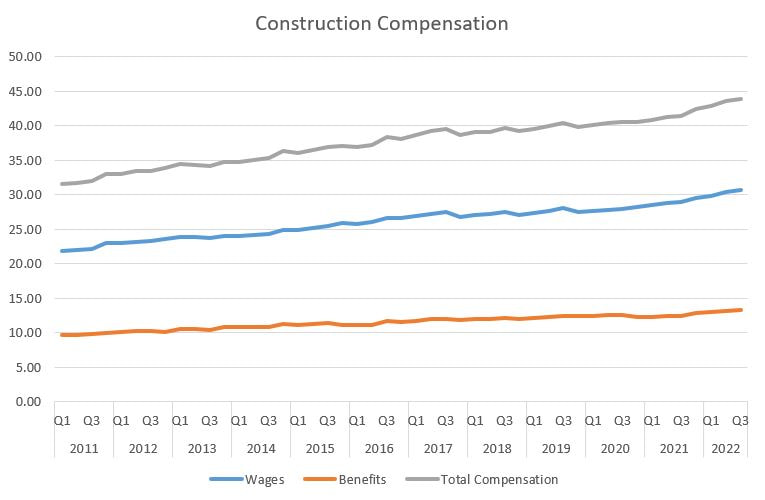 The y-axis on this chart is in dollars. Since 2011, total compensation has increased on an annualized rate of 0.7% per year. Since Q3 of 2021, the annualized growth rate doubled to 1.5%. This is a big jump, but the increase pales to the increases in construction materials.
For the time being, the extraordinary cost in construction can be blamed on material prices. If demand for construction stays at current levels and 1) supply chains get ironed out, and 2) we do not increase the number of people entering careers in the skilled trades, this dynamic could flip and labor costs will be the cause of accelerating construction costs. The slide in architectural billings continued this month with the American Institute of Architects (AIA) reporting an Architecture Billings Index (ABI) handle of 48 for February, down from 49.3 in January. This is the fifth straight month of sub 50 results indicating a secular decline. The ABI is a nine-to-twelve-month leading indicator of vertical construction activity, with ABI measures above 50 indicate that billings are increasing and those below 50 signal a decrease. After a few weeks of discussing potential bank failures, this result in ABI is an unwanted coda to a period of bad economic news. 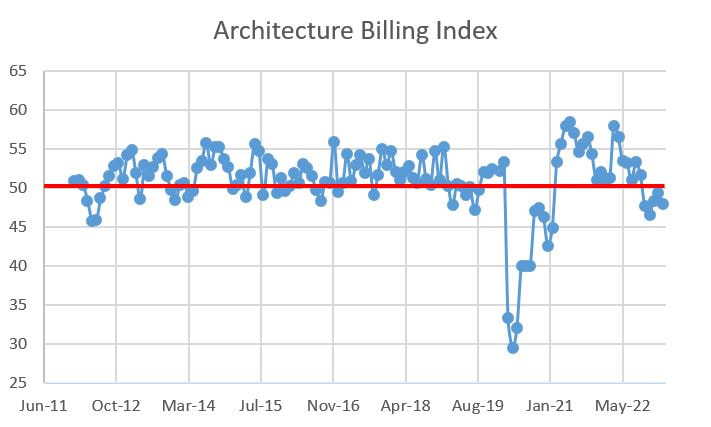 There were some slivers of good news in the granular data breakout, but the trends are not great. Billings in the West are above 50, but they are down month-over-month. The South, once the behemoth in activity, continues its slide. The only true bright spot is Mixed Practice, clocking in at 57, up from a robust 56 the month prior. Design Contracts remain above 50, but are way off from a year ago. Only the Northeast, West and Mixed Practice are up over the past year. 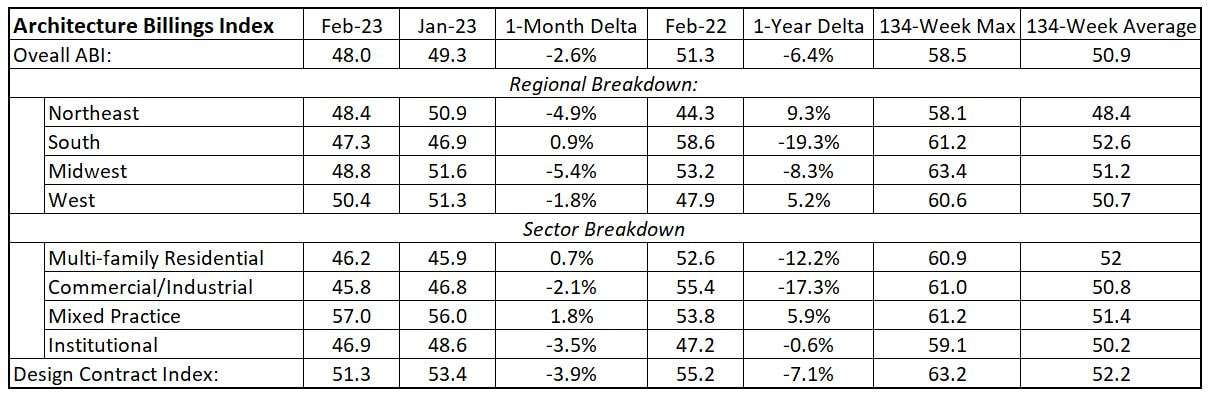 The best spin to put on this is that construction activity remains strong (for now...) and the recession that has been discussed for three years has yet to truly materialize. Given stubbornly high construction material prices and increasing interest rates, it is not surprising that design activity has softened. The big question is how long before we pull out of the tailspin. Up or down next month is a coin flip given the headwinds the economy is facing. The detailed data breakouts are below. 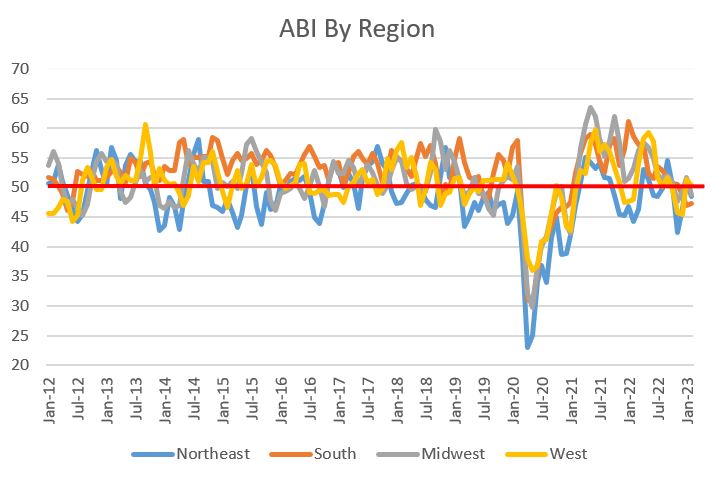 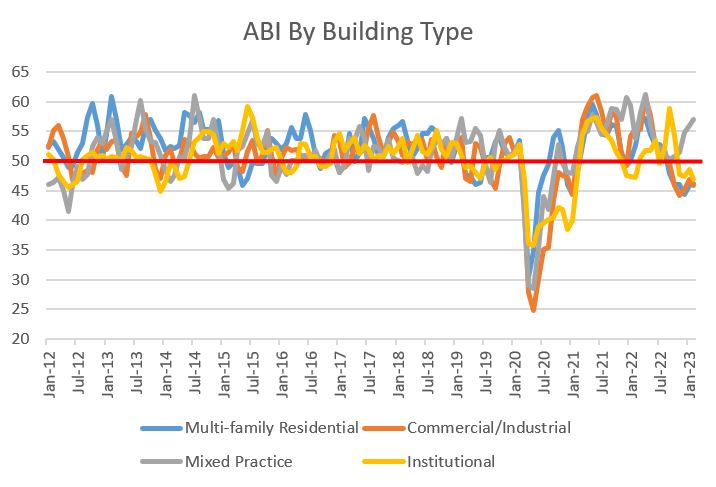 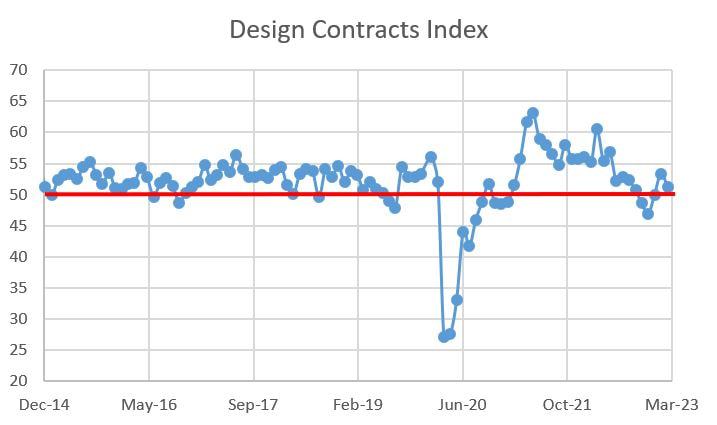 There was a lot of news on the employment front. On Thursday March 9, the Associated Builders and Contractors (ABC) reported that the number of construction job openings was almost halved from December 2022 to January 2023 (a decrease from 488,000 to 248,000). This was a shocking development until a few days later when construction employment was reports by the Bureau of Labor Statistics as reaching 7,918,000, the highest level ever. The construction industry has been steadily increasing in employment since May 2021. 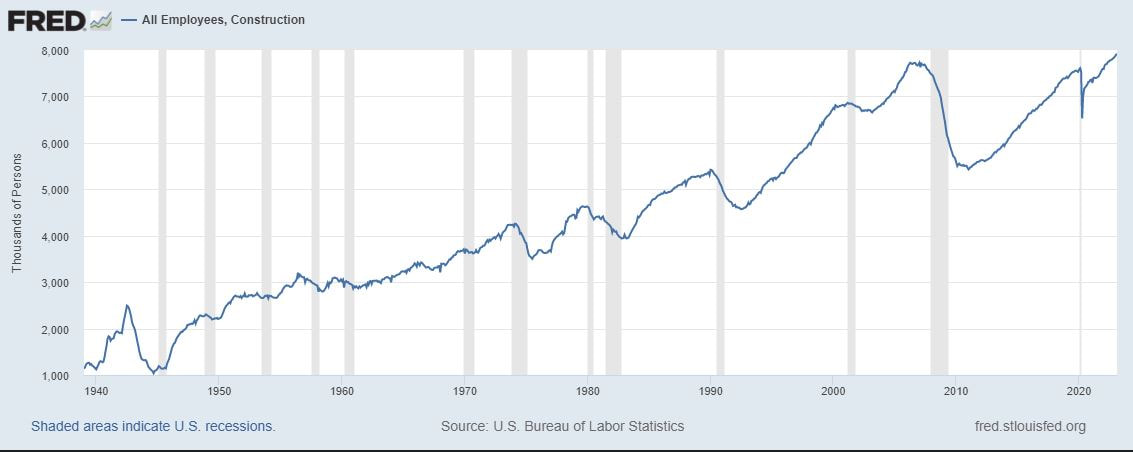 Current employment levels are well above the previous peak of 7.7 million in May 2007. This is amazing given the Fortune article published on March 10 (sorry, paywall protected) recounting an anecdote in the latest version of the Fed's Beige Book about a Montana-based contractor that flies its employees around in a private jet to fill operational need. As wild as that sounds, the article cited ABC data that shows we need to hire a lot more people even if the need for construction slows. 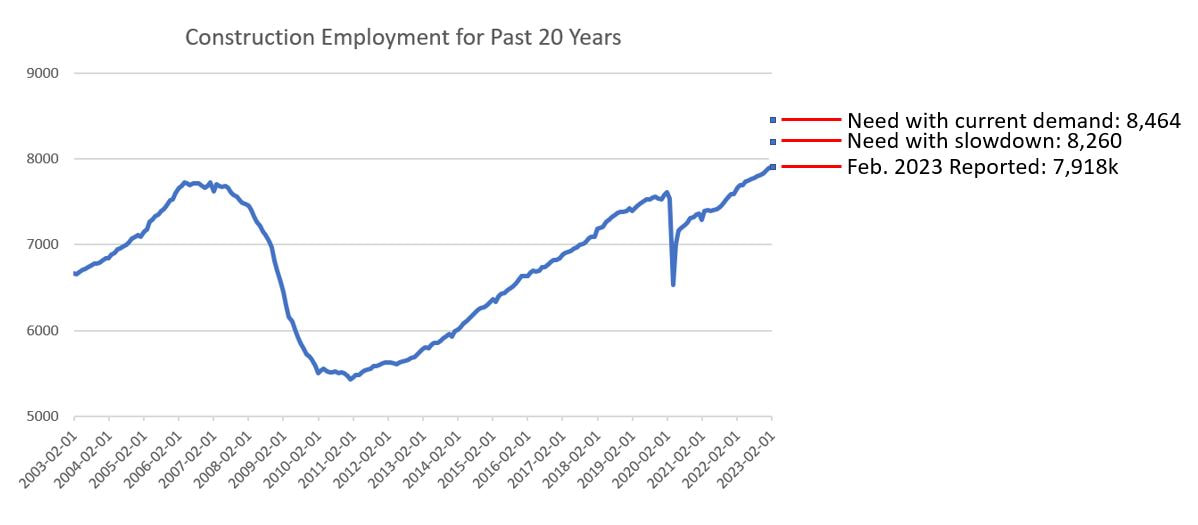 According to ABC, if the economy slows, an additional 342,000 construction workers will be needed, or 4.3% more than current levels. Should the need for construction stay at its current rate, an additional 546,000 workers will be needed, or 6.9% more than current levels. Given almost two years of employment gains, including adding 24,000 from the previous month, one might think that we will eventually add enough jobs, even it it takes a long time. But the Fortune article drops another statistical nugget that is terrifying for those trying to hire construction workers: a quarter of all construction workers are over the age of 55, revealing a demographic headwind that will make it incredibly difficult to to ever hire enough workers to meet foreseeable demand.
Increasing wages and a concerted effort to invest in infrastructure by local, state and the federal government, making construction jobs viable for the long term, might help attract people to the industry, but we will need more than that. Immigration reform and automation can also help, but both of those have policy implications. The future is bright for those in the industry, yet we have a lot to do to make the construction industry more appealing to a new generation of employees. Let's get the bad news out of the way: the American Institute of Architects (AIA) released the Architecture Billings Index (ABI) results for January and it landed at 49.3. ABI measures above 50 indicate that billings are increasing, while those below 50 signal a decrease, so 49.3 demonstrate a slight decrease in billings. The ABI is a nine-to-twelve-month leading indicator of commercial building construction activity, so this would indicate reduced vertical construction activity sometime between October and the end of 2023. 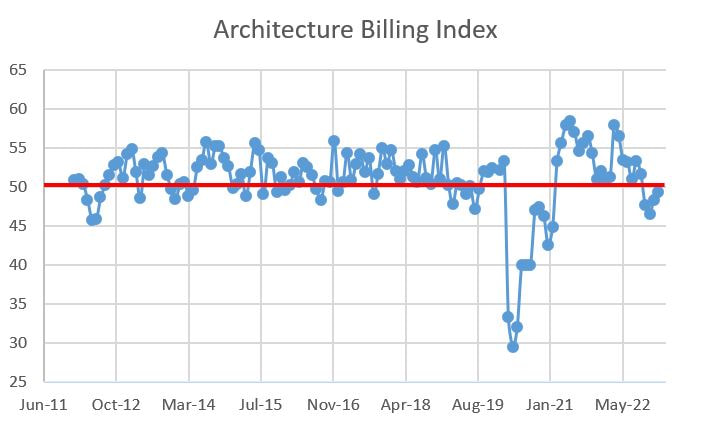 All that being said, the granular data paints a better picture. Three out of four regional ABI figures were above 50, as was one of four building sector ABI measures. Seven of eight regional and building sector measures increased from the previous month, and both Project Inquiries and Design Contracts measures continued to be north of 50 and increased month-over-month. So yes, the overall ABI is still less than 50, as is half of the sub-ABI data points, but things are getting better with the promise of additional increases next month (fingers crossed). 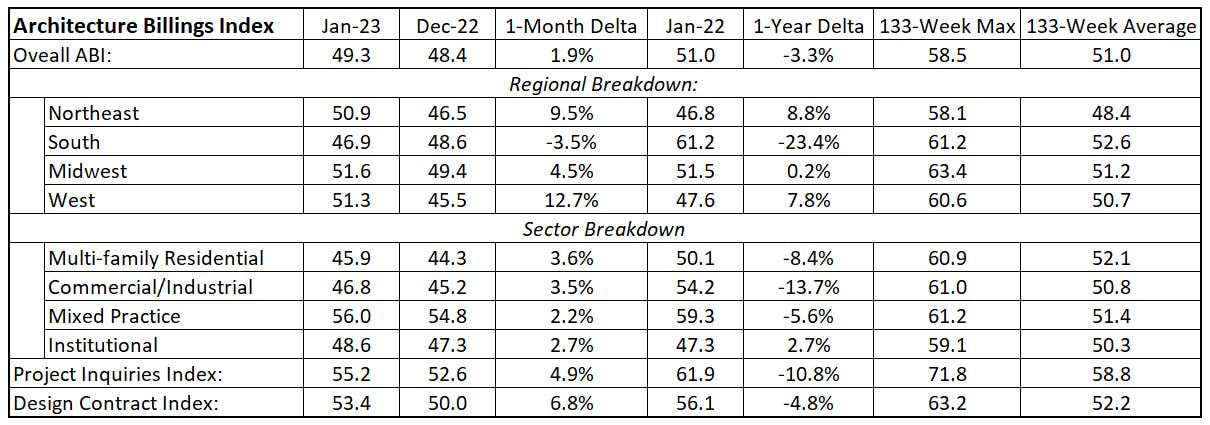 The year-over-year data reveals some interesting insights. The overall ABI is down 3.3% (49.3 for January 2023 versus 51 for January a year ago), but those losses are goosed by dismal YoY results for the South (down 23.4%) and commercial/industrial projects (down 13.7%), with multi-family (down 8.4%) and mixed practice (down 5.6%) dog piling on the decline. The South has been on a heater since I started tracking this data and has the highest 133-month average, so that almost quarter decline is surprising. Similarly, multi-family and mixed practice have the highest 133-week sector averages but have had a very poor 12 months. Perhaps we are seeing a regression to the mean. My hypothesis for commercial/industrial is twofold: 1) the commercial office market is still a mess due to continued work-from-home practices, and 2) the industrial market, particularly warehouses and distribution projects, is coming down from the COVID e-commerce fever dream. The details are below: 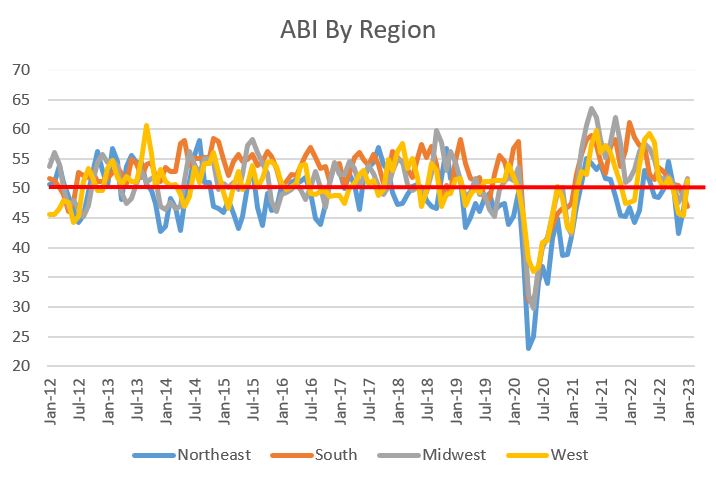 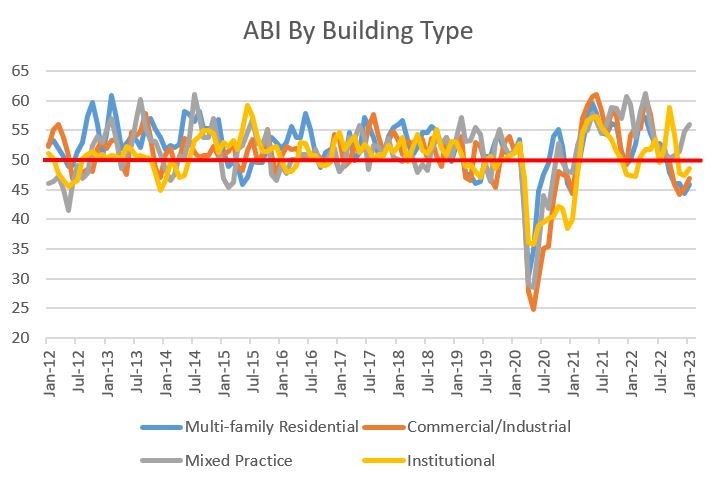 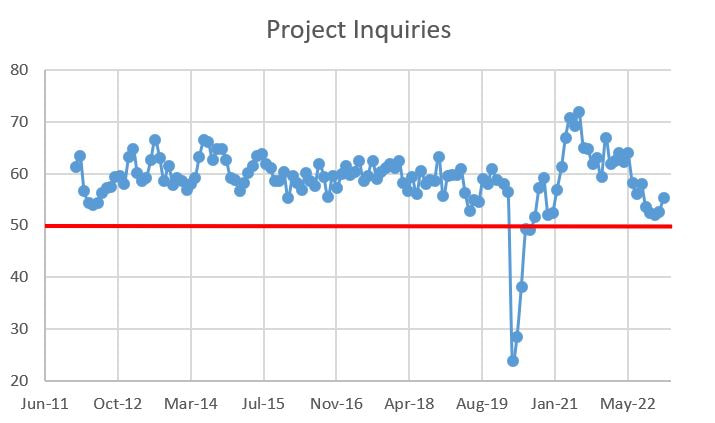 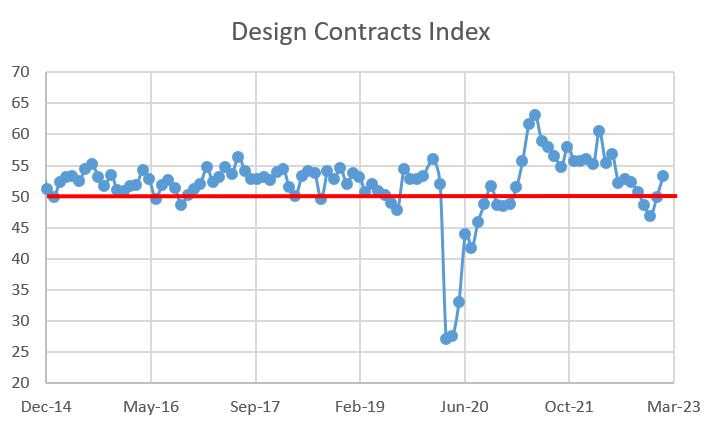
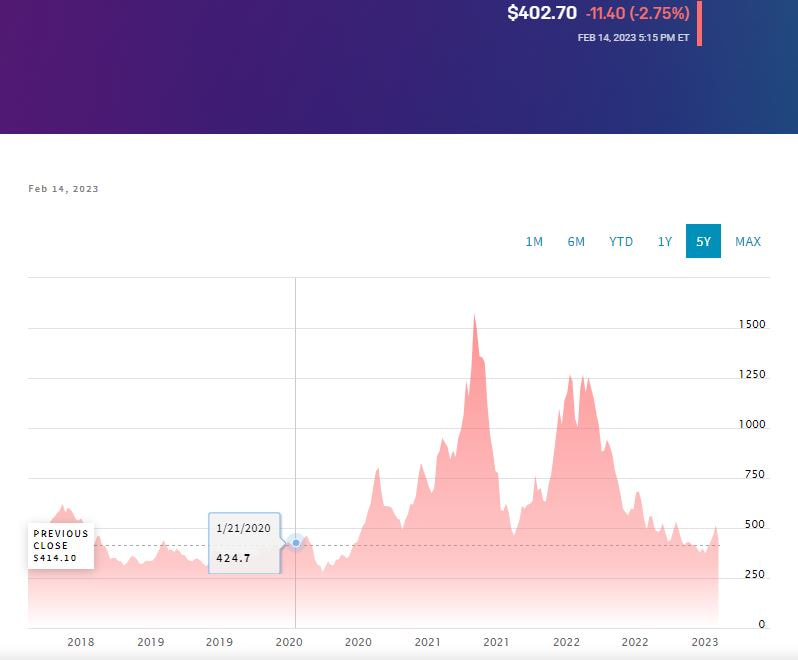 For the AEC industry, 2022 ended on a dour note, yet there is hope for 2023. The American Institute of Architects (AIA) released its Architecture Billings Index reading for December last week. The bad news is that the measure, clocking in at 47.5, indicated that billings are declining. The good news is that December was up from November's 46.6. Let's hope that this isn't a dead cat bounce. The ABI is a nine-to-twelve-month leading indicator of commercial building construction activity, with measures above 50 demonstrating that billings are increasing and those below 50 signaling a decrease. 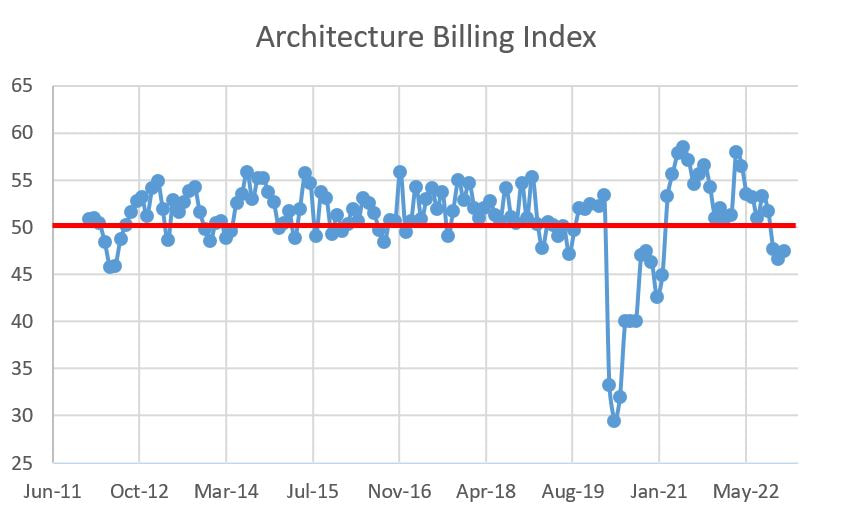 The last three monthly ABI results have come in under 50. This is not surprising given that the economy is still trying to digest information. Inflation is getting better but is still high by (recent) historical standards and economists are business prognosticators are still debating whether or not there will be a recession and, if yes, whether it will be soft or hard. The design and construction industry is feeling the whiplash of the manic economic data and while the ABI has turned down, there is still plenty of work for builders with the hope of more with funds from infrastructure bills shaking loose. Overall, the news is not great but it is note reason for panic either. 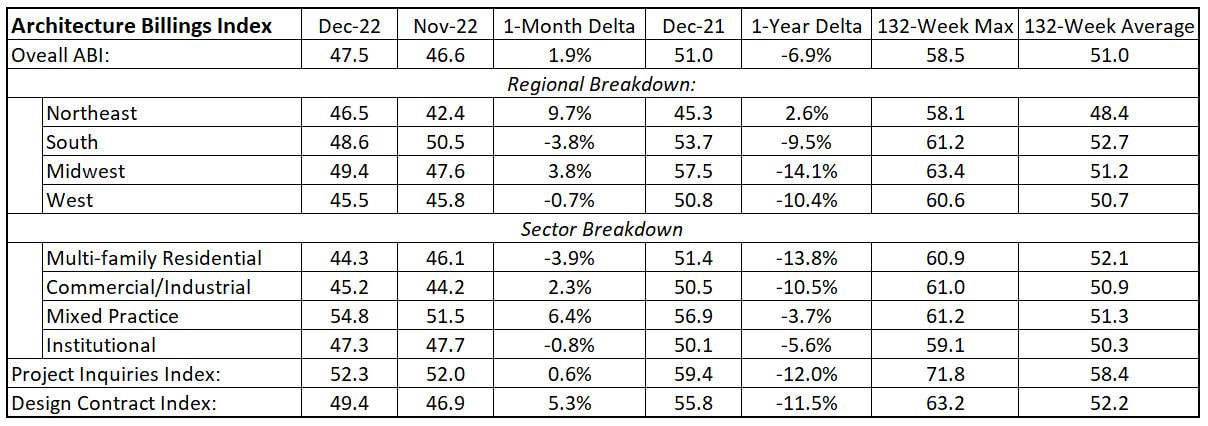 If you want to panic, here's your justification: a) save for the northeast, every regional and sectoral measure is down over the past year, and b) the most recent month's detailed data shows that regional and market segment data are all below the 132-month (11-year) averages except mixed practice. If you want a silver lining, focus on the fact that we are way up from when the design market cratered while we falling into the jaws of COVID-19 pandemic in the spring of 2020. You can see the market gyrations in the graphs below. 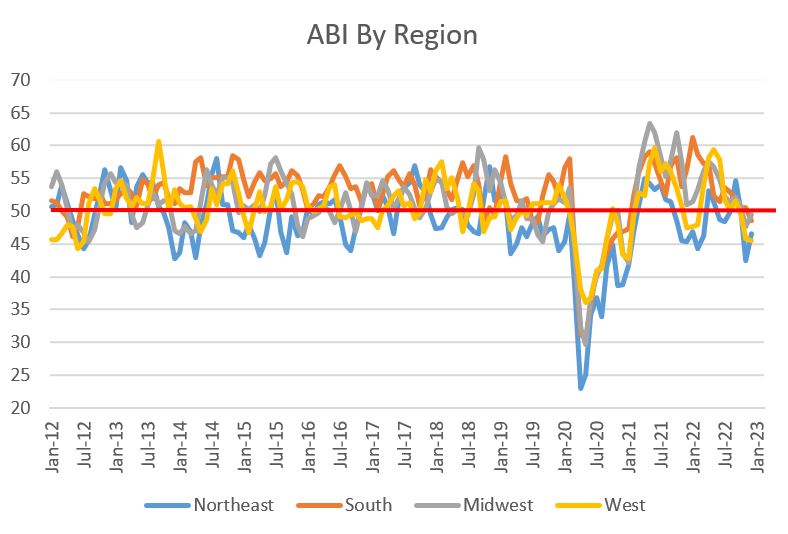 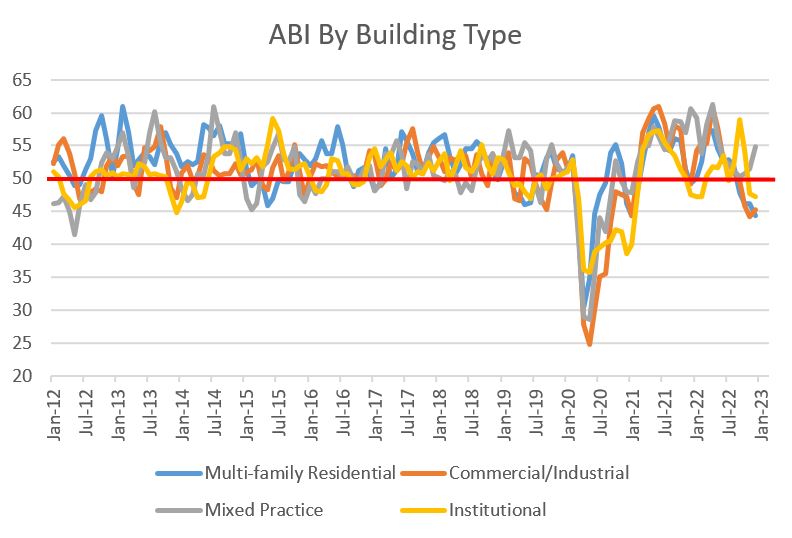 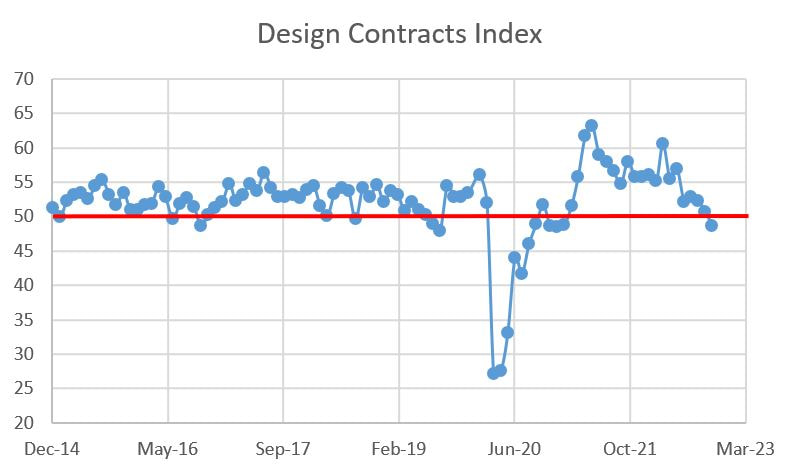 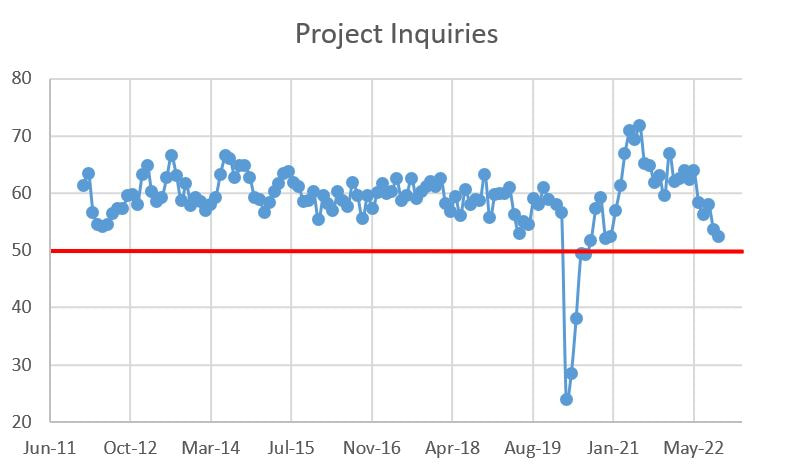 I tend to be a "glass-half-empty" type of pessimist. As such, the American Institute of Architects' (AIA) Architectural Billings Index (ABI) for October landing with a 47.7 handle would typically have me concerned about the wheels coming off the AEC industry wagon, but I am fairly sanguine about the measure. Before I explain why, let me restate that an ABI measures above 50 mean billings are increasing, while those below 50 signal a decrease. The ABI is a nine-to-twelve-month leading indicator of commercial building construction activity. 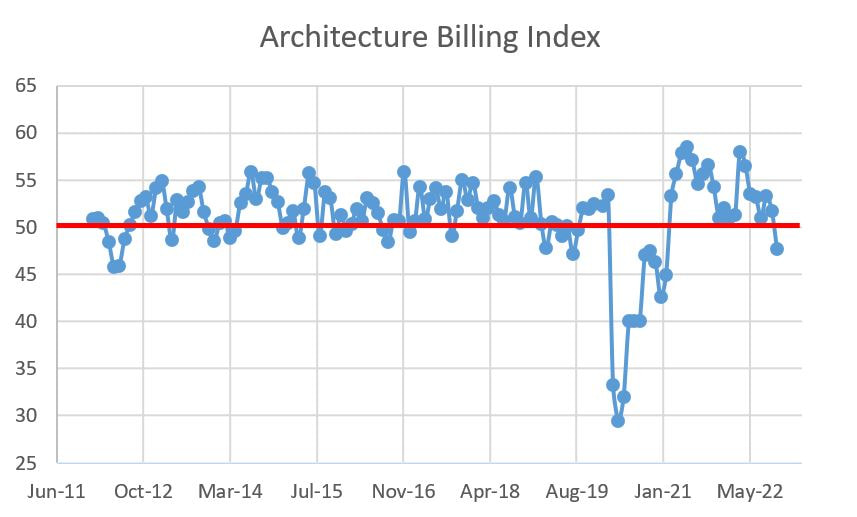 Having said that, how can a measure of 47.7, particularly after falling from 51.7 the previous month, not leave me worried? Well, this decrease was totally predictable. If not this month, then sooner than later. Why? well, there are plenty of predictors that we are heading for a likely recession. My favorite indicator is the spread between 10-year and 2-year treasuries (AKA the 10/2 yield curve). While a lot of people will argue the validity of the 10/2 yield curve, it is a pretty good reductive predictor of recessions. Essentially, when the yields on short-tern treasuries (2-year) exceed the yields of longer-tern treasuries (10-year), the “smart money investors” are predicting tough economic conditions in the short term (hence the demand for a higher yield). Right now, the yield curve is bending strongly towards a recession. Notice how when 2-year yields exceed 10-year yields (a negative yield curve, or when the graph below goes below zero), a recession seems to follow (select "max" for time period; the grey bands in the figure signify recessionary periods). If you want to geek out over the validity/invalidity of the 10/2 yield curve, shoot me an email or DM. A more tangible measure in the increasing Fed funds rate. The Federal Reserve Bank has been increasing their funds rate in a stated purpose of cooling the economy (specifically reducing inflation). While the Fed funds effective rate does not seem that high from a historical perspective, when it is at zero for several years, any increase seems painful. Notice also that recessions (grey bands) tend to follow periods of increasing rates. Taking these economic indicators together over the past several months has braced us for an economic slowing, and hence a decrease in ABI. Having said all that, here are the details. 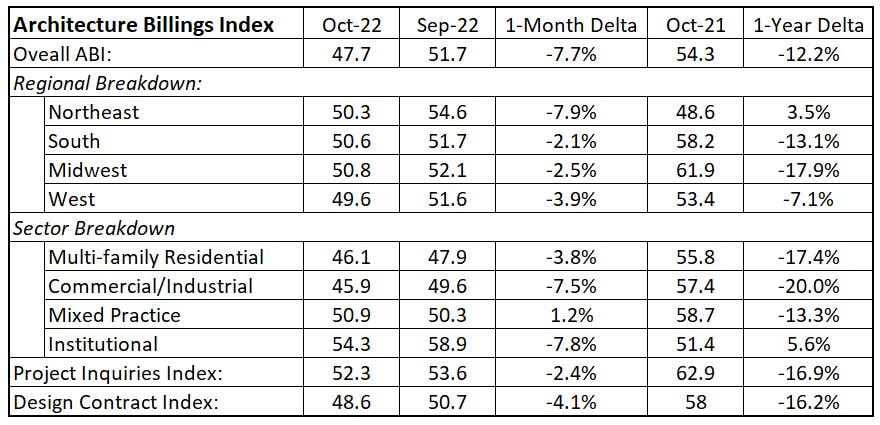 Similar to last month, the pain is localized. In fact, the only regional ABI that was below 50 was in the West, and that 49.6 measure is not that bad. In terms of market sectors, Multi-family Residential has decreased for two months straight (and rather sharply to boot). Again, this is predictable as this sector is particularly susceptible to increasing interest rates. Institutional, in spite of a monthly decline, has remained relatively strong over the past year and this may be due to planned government spending on infrastructure (which includes auxiliary building construction). Design contracts and inquiries are both down sharply but inquiries are still above 50. In spite of my relative positivity, one stat that concerns me is that, with the exception of the Northeast and Institutional projects, the sub-category ABI measures for October are all below their 130-month averages. 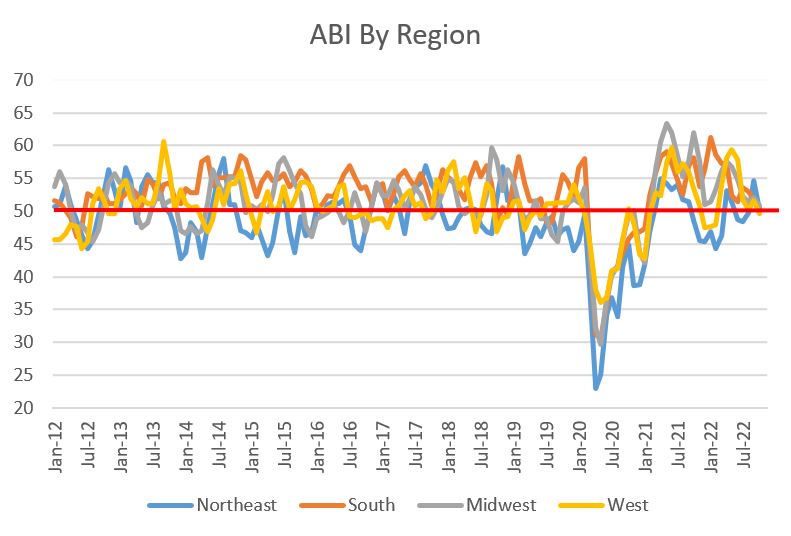 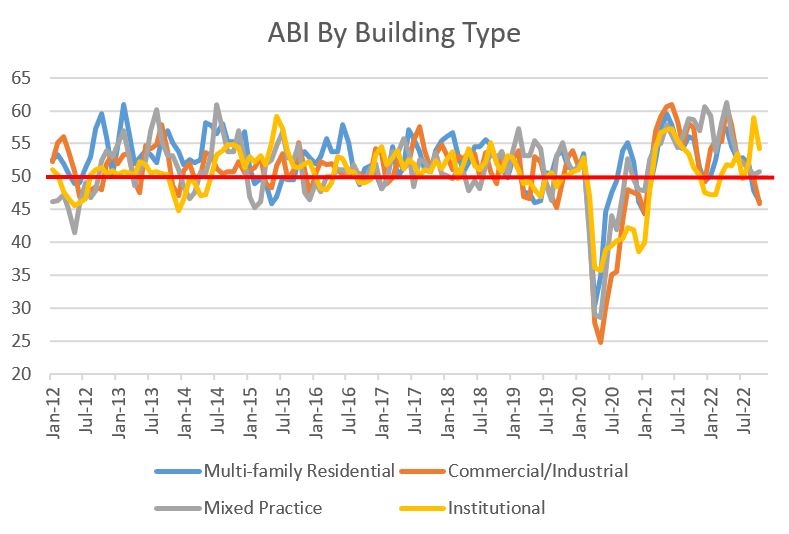 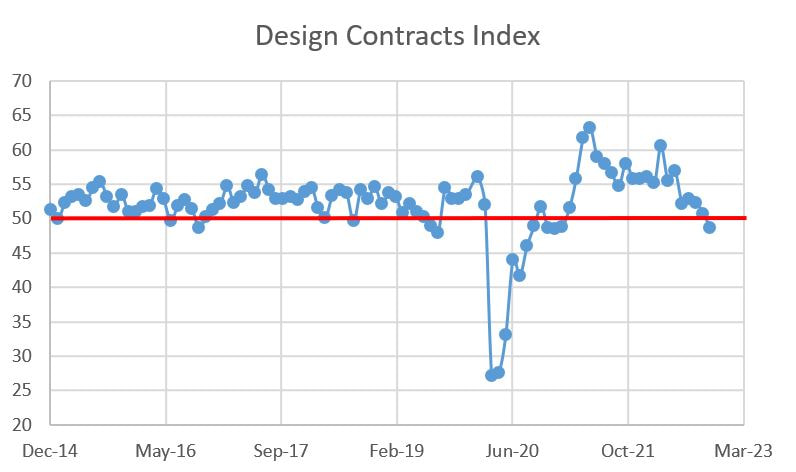 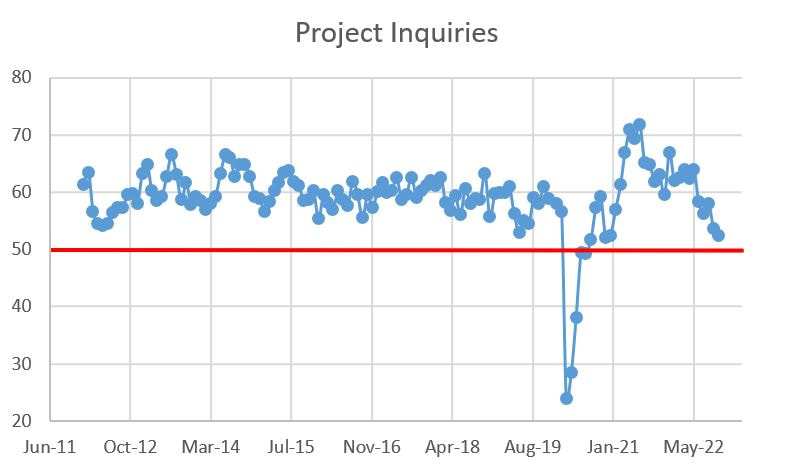 So the big question now is how long will this decline last? That is a tough question. While there are all these economic headwinds, some ginned up intentionally, there remains so much pent up demand for new buildings, especially housing. So if you are not buying my seemingly lack of panic, let me leave you with the news that construction starts accelerated 8% in October. The economy is behaving schizophrenically so be prepared for some wild gyrations over the next few months.
|
Archives
January 2024
Categories |
 RSS Feed