|
In a previous post I showed how architectural billings, a leading indicator of construction activity, has been very up-and-down since early 2021 after rocketing upwards from a pandemic-induced crater. In theory, contractor activity should similarly move similarly lagging by nine to 12 months. But that has not happened. Backlogs have steadily moved upwards since the tail end of 2021. Given that increasing backlogs are a proxy for how busy contractors are (and by extension, if backlogs increase, so should contractor pricing power, leading to higher fees), this is positive news that outperforms the AIA ABI expectations. 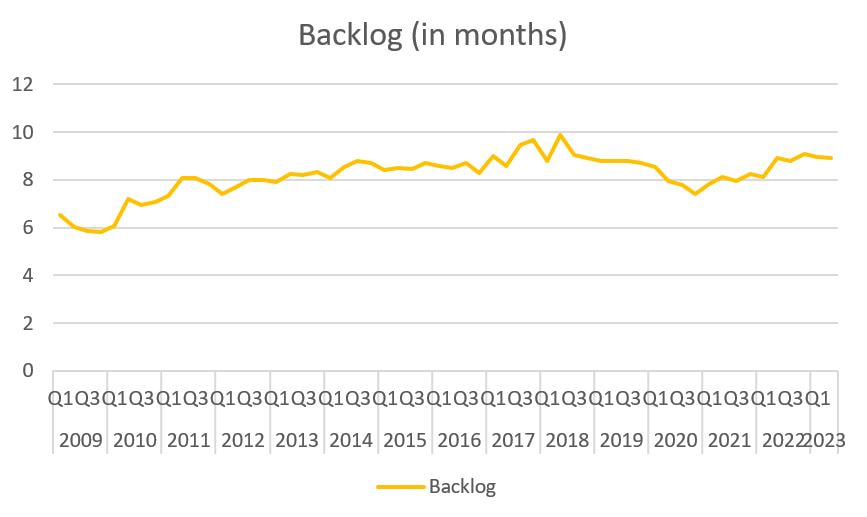 The above curve plots the average backlog by quarter, so the curve is smoothed. If we drill down into the month-over-month data, it reveals more, albeit mild, volatility. Overall backlogs are unchanged from May, but drilling into the industry breakdown shows some randomness, with Heavy Industrial down big but Infrastructure up even bigger (Federal infrastructure bills perhaps? Infrastructure is up over 40% year-over-year). The story is similar for regional and company size breakdowns. 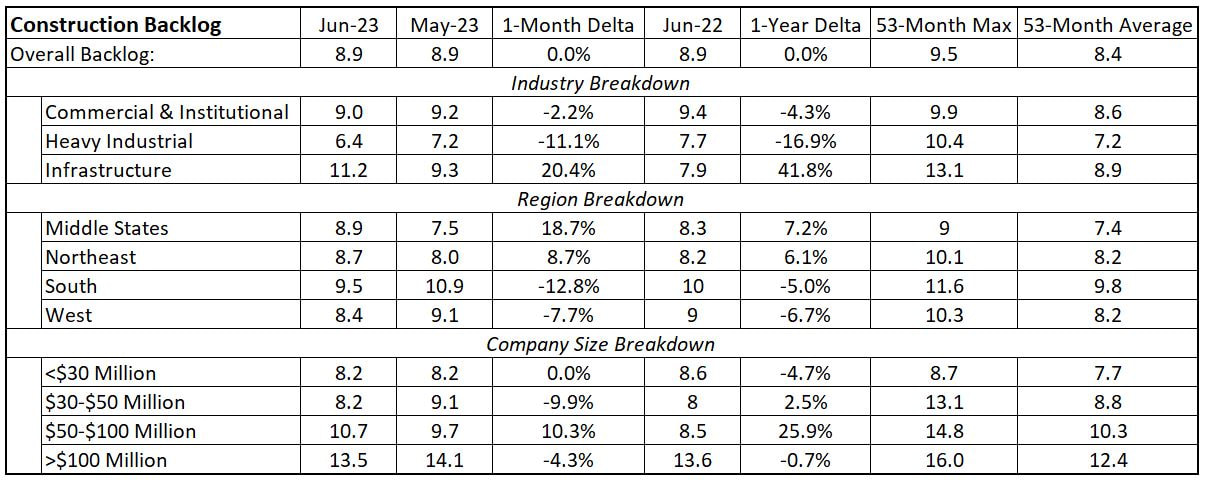 The reductive hot take is that it is a good time to be a $50-100 million per year contractor performing infrastructure work in the northeast and midwest markets. More detailed information is below: 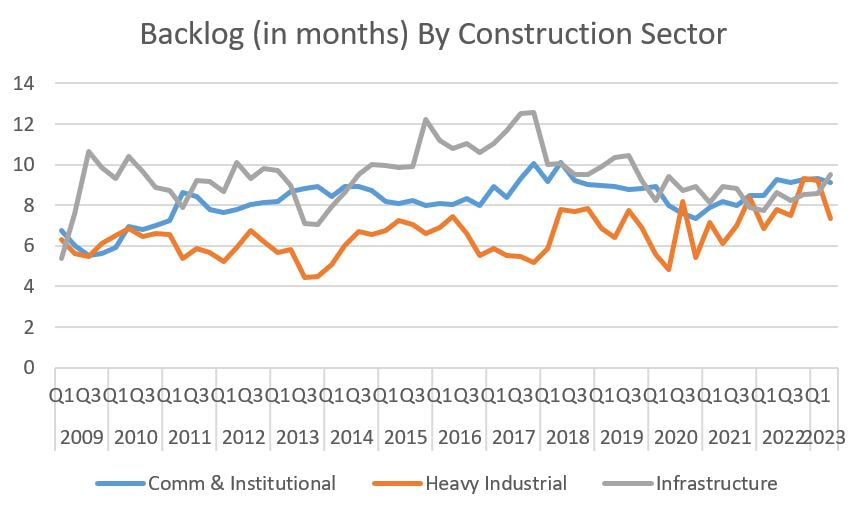 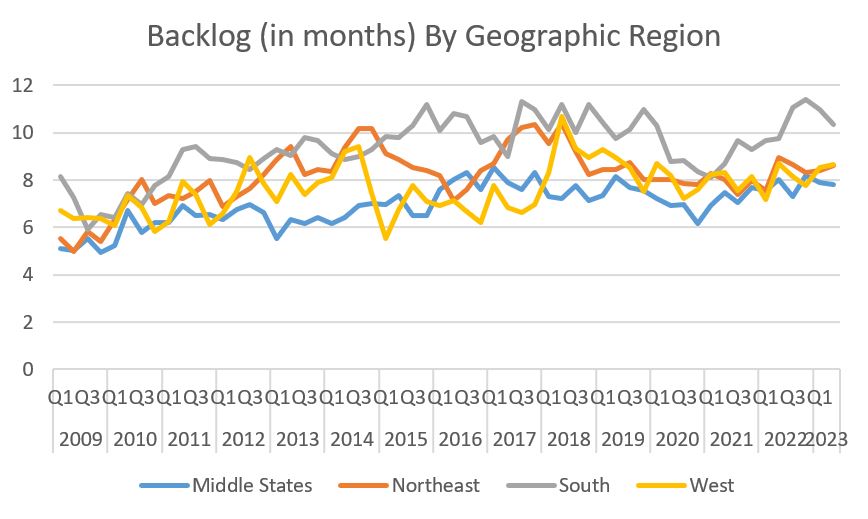 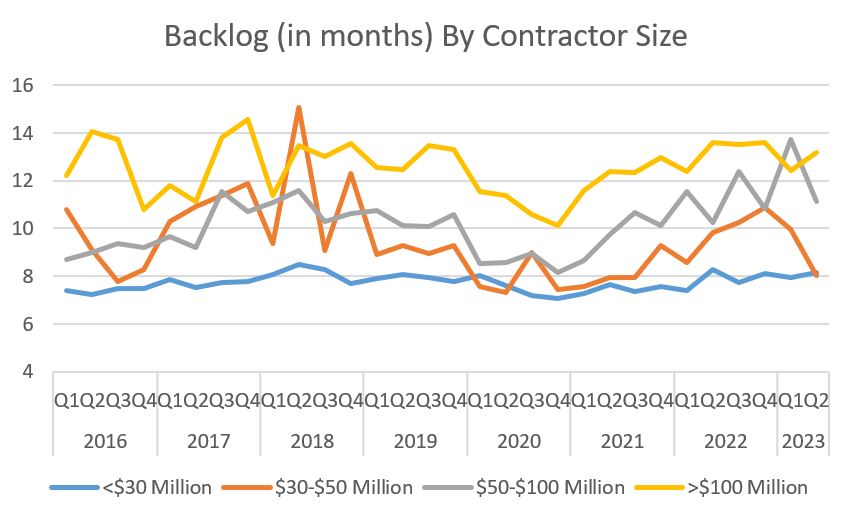
2 Comments
Will
7/21/2023 02:08:43 pm
Anticipate a widening gap between ABI and Contractor Backlog in the private sector in the opposite direction until interest rates and the banking sector stabilize. Projects may get entitled and drawn but not built as long as financing remains uncertain.
JReg
8/1/2023 06:08:29 pm
Great point Will and I agree with you. Leave a Reply. |
Archives
January 2024
Categories |
 RSS Feed