|
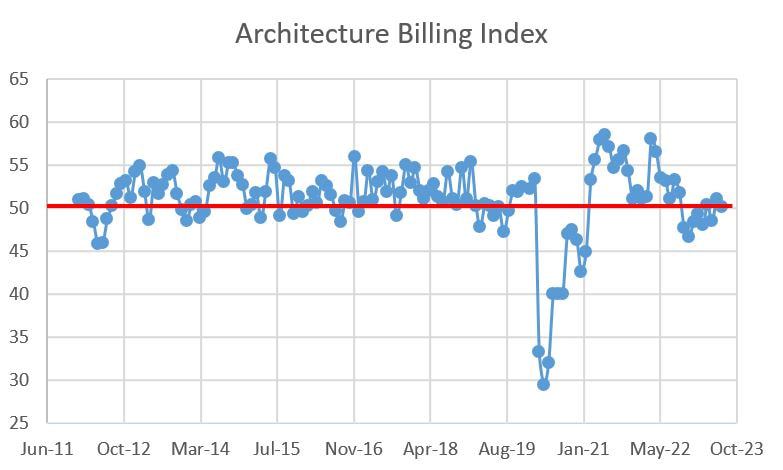
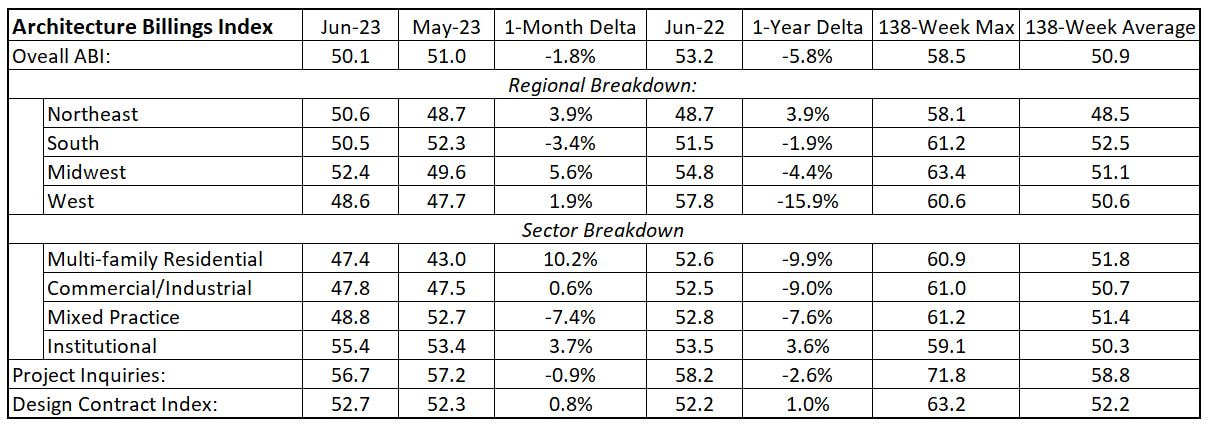
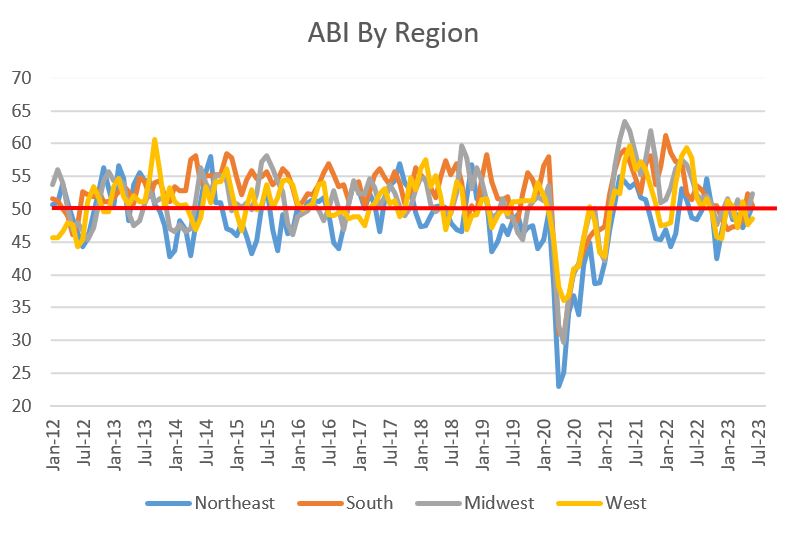
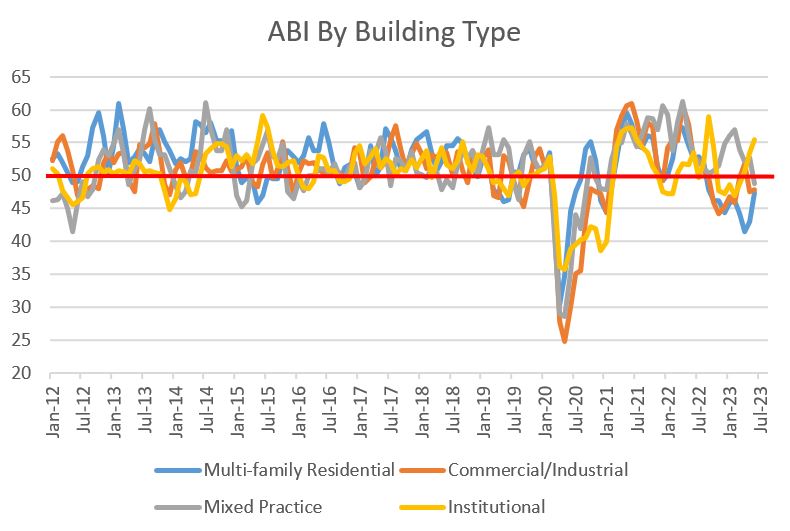
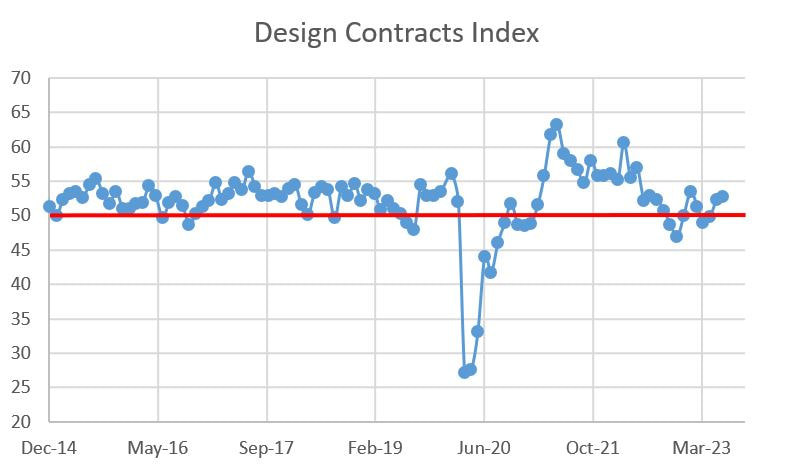
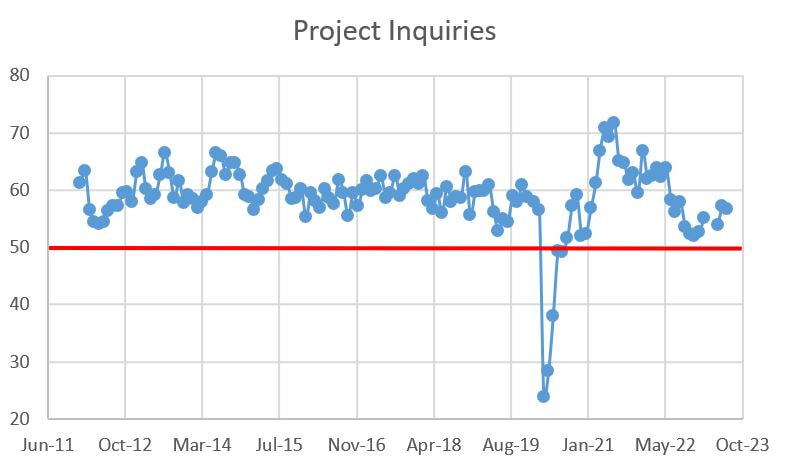
The Architecture Billings Index (ABI) as reported by the American Institute of Architects (AIA), is clinging to the increasing billings side of the ledger with a 50.1 handle for June. The ABI is a nine-to-twelve-month leading indicator of building construction activity, with ABI measures above 50 indicating that billings are increasing and those below 50 signaling a decreasing billings. While June's reading was down from May's 51, this is the first two-month positive streak since August/September of last year. The data was largely mixed, with half of the sub measures above 50 and four of ten increasing month-over-month. Seven of ten measures are down year-over-year, with the West falling by almost 16%. While the architecture/engineering/construction market clearly ripped up from the COVID chasm, the ABI performance has whipsawed since 2021. While the industry seems really busy, the capacity to deliver projects has been hampered by supply chain issues, lack of labor and, more recently, increasing interest rates. As long as those headwinds persist yet demand remains high, we will likely continue to experiencing seesawing ABI figures.
Detailed data can be seen below:
0 Comments
Leave a Reply. |
Archives
January 2024
Categories |
 RSS Feed