|
The figure below shows that government spending on structures is falling off a cliff (down about 27% in 12 years): 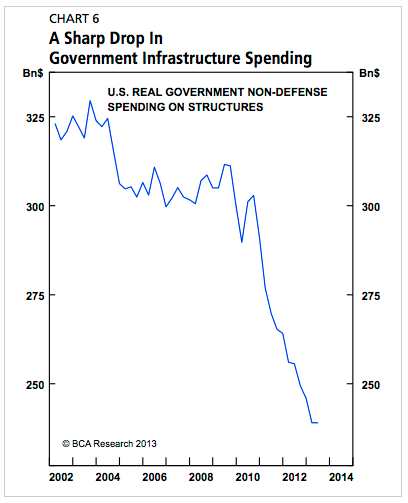
A lot of people commenting on this chart are using it to show government underinvestment in structures, raising alarm as our country's infrastructure falls into a state of decay. With the high profile bridge collapses from the past few years still on our minds, this is a reasonable reaction. What the chart doesn't capture is how public investment in public structures has increased significantly over the past decade or so. I'm not suggesting that private investment will offset the reduction in government spending, but I speculate it creates a dent. I will be looking into this because I'm curious. Stay tuned for more.
0 Comments
Leave a Reply. |
Archives
January 2024
Categories |
 RSS Feed