Builder blog

Current events and commentary regarding the construction industry. Opinions are my own.
Justin Reginato, Ph.D.
  • About
  • Builder Blog
  • Tacos & Tower Cranes
  • In the News
  • For Students

Boffo News in the Housing Market (but read this entire post for the catch) [UPDATED]

12/27/2012

0 Comments

 
I thought I was done talking about real estate for 2012.  But a wave of good news has been landing so I wanted to pass it along.  Just to reiterate, my primary interest in the single family housing market is that it is an indicator of the health of the overall construction market and the economy in general.  Very few of my students and industry friends are in the single family construction industry, but good health in that market generally points to good news in the market for other (bigger and more complicated) construction projects.  I'll separate the news by date.  See if you can detect the trend:

December 20, 2012:
  • CoreLogic reports that home sales are up 6% to 5 million (5 million of what, I'm not sure, but I strongly suspect single family homes.  Over what period of time is a mystery.  Year-over-year or for 2012 possibly...).  Inventory is at a 10+ year low.  The median price of non-distressed homes is up 16% (more on distressed homes below).
  • The National Association of Relators (NAR) reports that distressed home sales accounted for 22% of November sales (12% foreclosures, 10% short sales), down from 24% in October and 29% in November 2011.  Bill McBride of the Calculated Risk blog points out that distressed sales tend to pick up in the winter months. NAR further reported that home sales were up 14.5% year-over-year in November, or 20.9% year-over-year adjusted for seasonal effects (as the Case-Shiller home price index takes into account).

December 26, 2012
  • Speaking of the Case-Shiller home price index, it was up 0.66% from September to October, outpacing the expected increase of 0.48%.  The year-over-year increase is 4.31%, above the expected 4.00%.  For more on the Case-Shiller data (including figures), click here.
  • The Lender Processing Services (LPS) Home Price Index (HPI) reported a 0.3% increase in U.S. home prices last month, with a year-over-year price increase of 4.3%.  Quoting Bill McBride (he was on fire over the last week reporting real estate goings-on): "Looking at the year-over-year price change throughout the year - in May, the LPS HPI was up 0.4% year-over-year, in June the index was up 0.9% year-over-year, 1.8% in July, 2.6% in August, 3.6% in September, and now 4.3% in October.  This is steady improvement on a year-over-year basis."
  • Zillow presented all sorts of cool information: 1) Home values have increased 5.3% since the bottoming of the housing market in 2011; 2) Zillow predicts a 2.5% increase from November 2012 to November 2013 (I'm weary of predictions, though...); 3) Only 10 of the 255 metro areas tracked by Zillow have not bottomed out; 4) 28.2% of homeowners are underwater with their mortgages (they owe more on their mortgages that their home is worth).  This is the first time the percentage has been under 30% since Zillow started tracking it in early 2011.  This is a positive trend, as when people are above water on their mortgages, they have equity in their homes which makes them feel wealthier (which will make them more likely to spend money, which spurs the economy).  We'll discuss the flip side of underwater mortgages below [UPDATED]: I found this article that states that economists at IHS Global Insight, using data collected by CoreLogic, have determined that the recent increase in home prices have lifted 1 million homeowners above the water line on their mortgages.  Since they don't give the total number of homes, we don't know if 1 million is a high percentage or not.  But it's a cool stat nonetheless; and 5) Interest rates continue to be near historic lows.  [UPDATED: annual average 30-year fixed rate mortgage rates are near the lowest in 65 years.  See this article fore more info] This means home buyers can get more home for their mortgage payment when rates are low.

December 27, 2012
  • Consensus Bureau reports that new home sales seasonally adjusted annual rate (SAAR) for November is 377,000.  Per Mr. McBride, this figure is 4.4% above the revised October rate and a 15.3% increase over the November 2011 rate. [UPDATE]: I forgot to insert this figure, which is a gem:
Picture
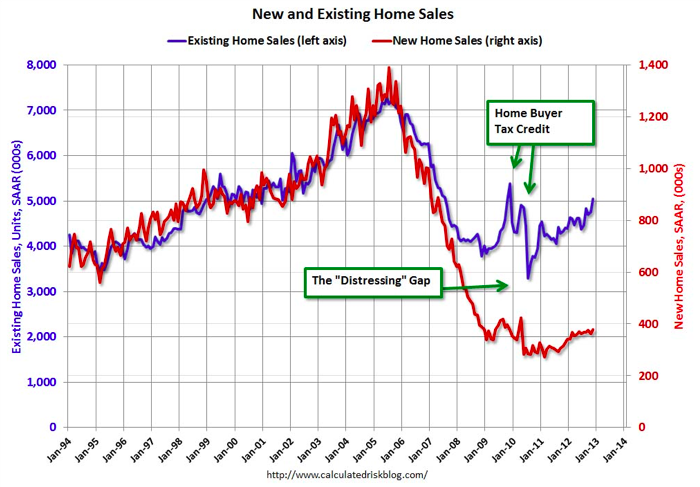
Existing home sales outpaced new home sales during the recession because many of the existing home sales were of distressed homes at bargain basement prices.  New homes could not compete with the lower priced existing homes, so sales of new homes fell.  As the number of distressed properties decreases, new home sales should increase, closing the "Distressing " Gap.  This is good news for general contractors, because as new homes are built, so are adjunct buildings (schools, firehouses, retail, etc.).
Other Miscellaneous Data:
Picture
Picture
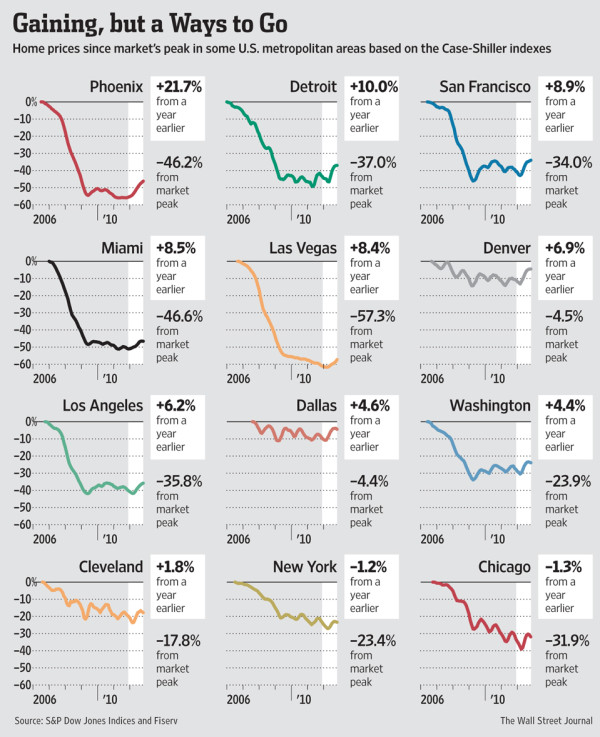
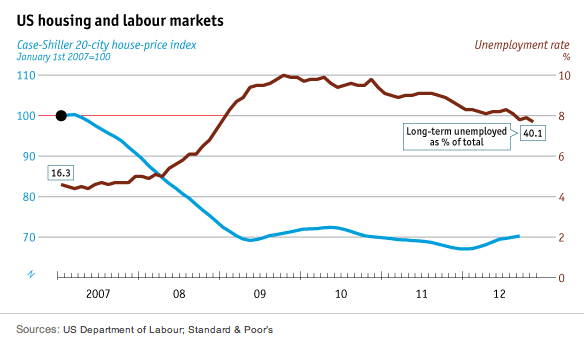
Looking at the two figures above, the Case-Shiller price index is getting better in most places in the U.S., particularly the places that were hit hardest during the downturn (Phoenix, Las Vegas, Miami, I'm looking at you).  However, we are still a long way from the pre-recession peaks.  The second figure I threw in this post because I found it interesting.  It seems, at least from 2007 on, that the Case-Shiller index and unemployment are inversely proportional.  So, if unemployment decreases, hopefully Case-Shiller will increase (sort of a master-of-the-obvious observation).

OK, so what does all the data above show?  It seems to indicate that the housing market is getting better.  This would traditionally indicate that the economy is getting better and that construction activity should be increasing (institutional and commercial construction tend to lag housing).  This should be good news for general contractors.  Except...

What's the bad news?

Sorry, but we're not completely in the clear.  In fact, there is a considerable amount of uncertainty in the market.  It stems partly from:
  • Remember that positive trend in the decrease in underwater mortgages?  Well, that knife cuts both ways.  There are still 28.8% of mortgages underwater.  This makes it more difficult for owners to sell their homes (they tend to keep their homes on the market longer, holding out until they get a price that will put them above water).  Also, as long as people are underwater, they have the reverse wealth effect, not spending money that would spur the economy.  Also, distressed sales (foreclosures and short sales) reduce the overall median price of housing, and there's still a health percentage of them occurring. 
  • Noted economist Robert Shiller (of the Case-Shiller home price index fame) isn't buying into the improving housing market.  In an interview on CNBC on December 20, he stated that he's not convinced that housing prices have bottomed out yet and that even as they start to rebound, he doesn't "think a boom is in the cards.  We might see home prices go up a little bit, you know, a little bit above inflation, maybe.  Not likely we'll see a real boom."  Not exactly a call on a a bull market in housing.  Of course, he did say this before the most recent Case-Shiller data came out. </sarcasm>
  • [UPDATED: I forgot to mention this when I originally made this post, but even with the strong uptick in housing sales, 2012 is set to be the 3rd lowest year for new home sales (363k units sold) since 1963, which is when the Census Bureau started collecting new home sales data.  The two years with lower sales were 2010 (323k units sold) and 2011 (306k units sold).  This shouldn't be totally surprising, as many cities are are way off their highs (see figure above with Case-Shiller data for specific metro areas).]
  • Let's not forget a major force spurring home sales: low interest rates.  The Federal Reserve is keeping rates low through quantitative easing (QE), which cannot go on forever (I could go into detail on QE and mortgage-backed securities, but this post is already running long, so read this article posted by TIME Magazine).  At some point, mortgage rates will have to go up.  If they do so while we still have relatively high rates of unemployment and stagnating (or worse, declining) wage growth, these improvements in the housing market will come undone fast. 

So the housing market looks like it's improving and the data supports that it is.  But lurking in the background is a fragile economy (and we haven't even mentioned the fiscal cliff or any other external factors that could upset the market).  If this housing market improvement has legs, then that's good news for the construction industry (and the economy as a whole).  If it doesn't, well, we're stuck in the same slow construction market we're currently slogging through.  I guess like many things in life, we'll just have to wait and see.

But wait there's more!

I want to leave you with one last figure, again courtesy of Bill McBride:
Picture
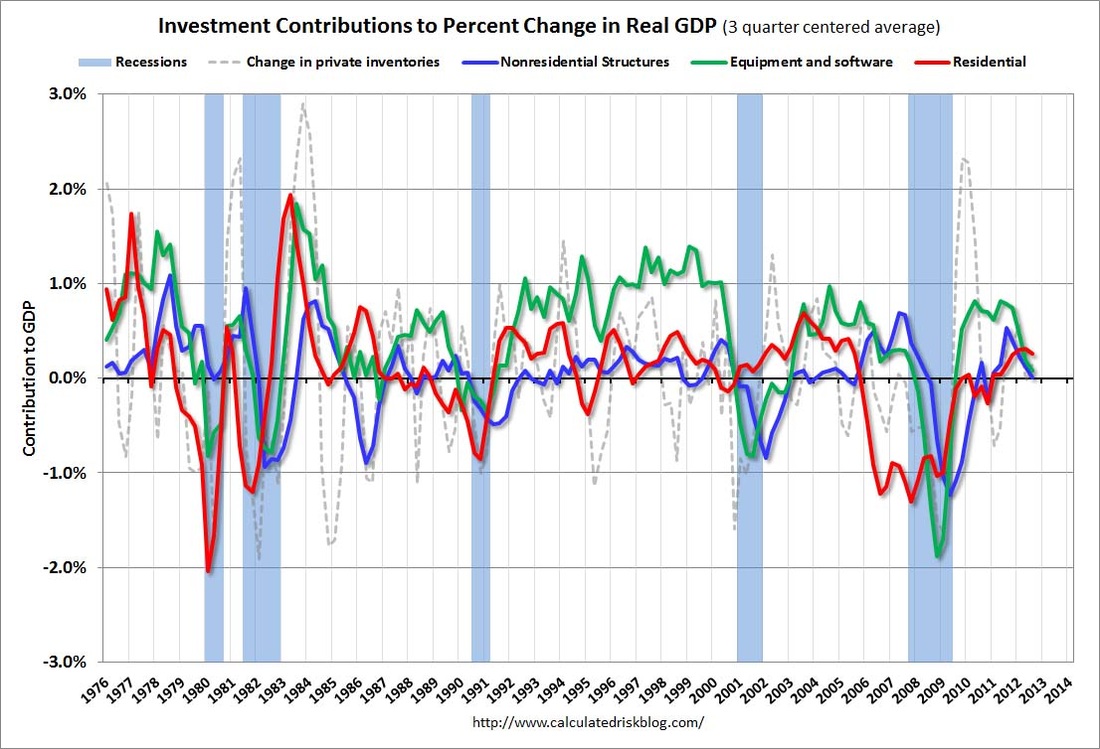
The above figure shows the contribution to GDP from residential investment (which includes home building), equipment & software, nonresidential structures (what general contractors should be interested in), and "change in private inventories."  These are the four categories of private investment.  As discussed above (and in other posts), residential real estate tends to be a leading indicator of the economy and nonresidential structure investment is a lagging indicator (equipment and software is neutral).  But this didn't happen in this recovery--housing has lagged.  This was due to the inventory that grew so large during the recession (but has been slowly been whittling down).  Perhaps this recent (2012) strengthening in the housing market is the indicator that the economy is getting stronger, all other signs weakness notwithstanding.  If so, then expect the blue line in the figure above to reverse course, a trend that would be positive for general contractors.  For Bill's full post on this (which is a very worthy read), click here.
0 Comments


Leave a Reply.

    Archives

    January 2024
    October 2023
    August 2023
    July 2023
    May 2023
    April 2023
    March 2023
    February 2023
    January 2023
    November 2022
    October 2022
    September 2022
    July 2022
    June 2022
    May 2022
    April 2022
    March 2022
    February 2022
    December 2021
    November 2021
    October 2021
    September 2021
    August 2021
    July 2021
    June 2021
    May 2021
    April 2021
    March 2021
    January 2021
    December 2020
    November 2020
    October 2020
    September 2020
    August 2020
    July 2020
    June 2020
    May 2020
    April 2020
    September 2019
    August 2019
    September 2018
    June 2018
    April 2018
    March 2018
    February 2018
    January 2018
    March 2016
    February 2016
    January 2016
    November 2015
    February 2015
    December 2014
    November 2014
    September 2014
    August 2014
    July 2014
    June 2014
    May 2014
    April 2014
    March 2014
    February 2014
    January 2014
    December 2013
    November 2013
    October 2013
    July 2013
    April 2013
    March 2013
    February 2013
    January 2013
    December 2012
    November 2012
    July 2012
    May 2012
    April 2012
    February 2012

    Categories

    All
    Economics
    Real Estate
    Technology

    RSS Feed

Proudly powered by Weebly
  • About
  • Builder Blog
  • Tacos & Tower Cranes
  • In the News
  • For Students