|
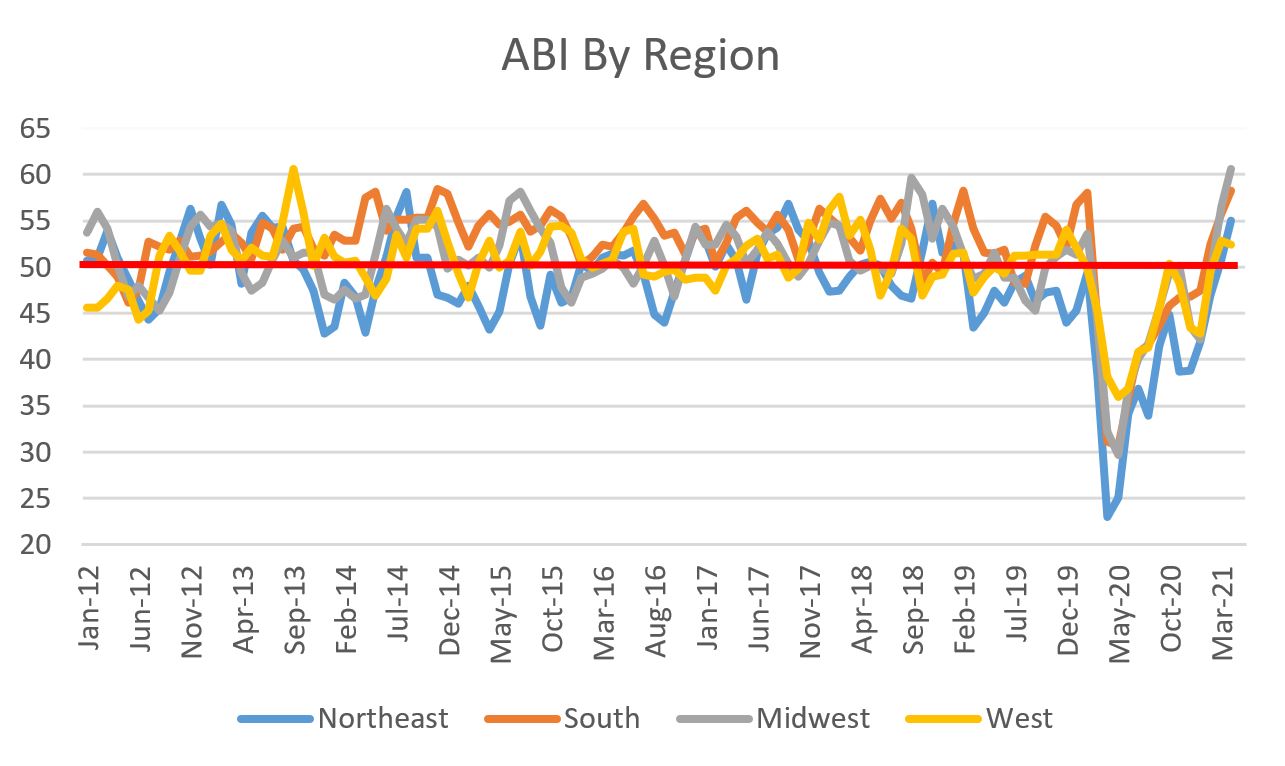
A year ago, the world seemed like it was ending and design and construction industry was grinding to a screeching halt. The The American Institute of Architects' Architecture Billings Index (ABI) hit a cataclysmic low of 29.5, mimicking the 10,000-point drop in the Dow Jones Industrial Average (a decline of almost one third). Today, is a lot different. Like the Dow, the ABI has rebounded and summited new heights. The April ABI reading came in at 57.9, the highest reading in my database which goes back to 2012. That is not the only high-level mark reached last month; read on for more details. But first, a reminder that we care about the ABI because it is a great nine-to-12 month leading indicator of construction activity. A value greater than 50 means that architecture billings are increasing; conversely, any value less than 50 means billings are decreasing. And right now the ABI is accelerating like a rocket. 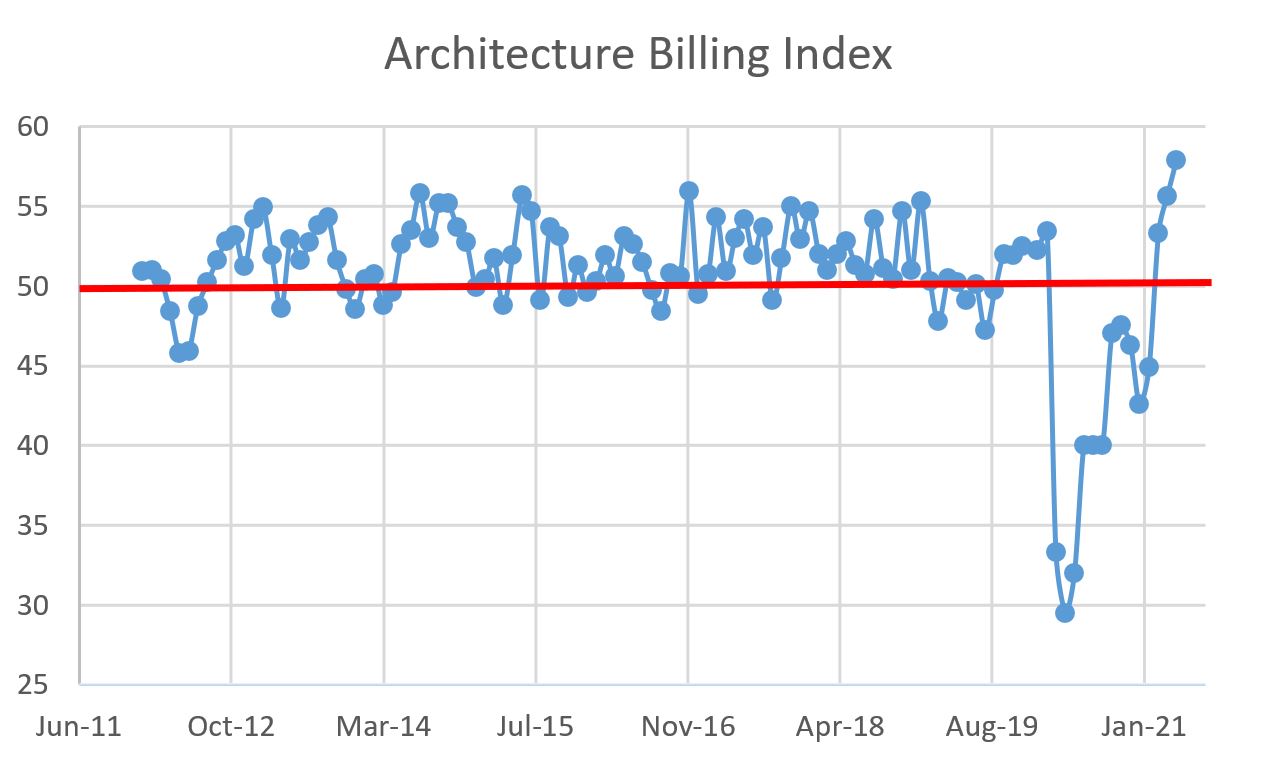 The regional ABI metrics were all up strongly except one but all have easily cleared the 50 hurdle:
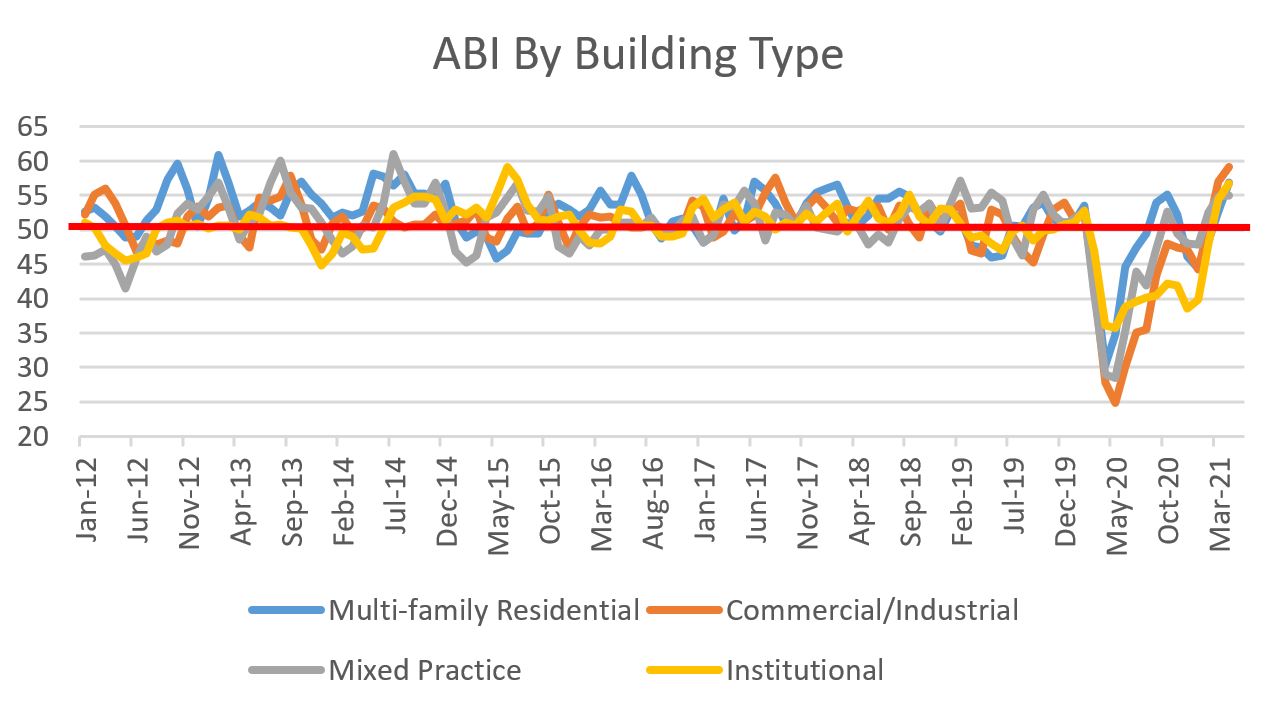
 The industry sector breakdown shows gains across the board:
 Lastly, Project Inquiries also scaled to a new peak, clocking in at 70.8. While this is a measure of people kicking the tires on projects, the enthusiasm shows that there is potential for the various ABI measures to go higher. I hope I did not just jinx the rally. 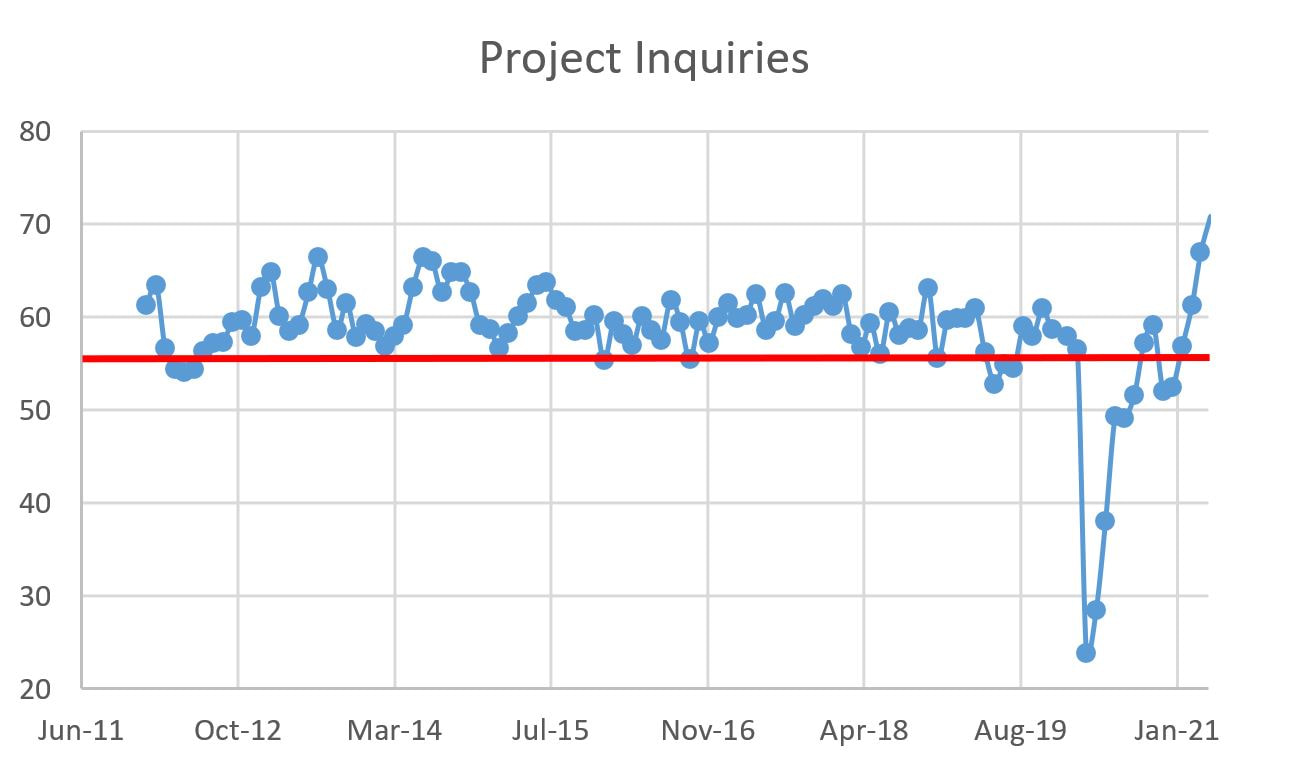 This data is great news, but there are some challenges for the industry to work through. Construction costs are rising as we have constraints on the supply of skilled labor and lumber costs continue to soar (I mean WTF?). These and other issues have people breathlessly talking about the dreaded "I" word (inflation), which would negatively alter the financial viability of projects. But for right now, let's celebrate that the design and construction industry are busy and that the pain of the ABI lows are a year in the rearview mirror.
0 Comments
Leave a Reply. |
Archives
January 2024
Categories |
 RSS Feed