|
For the AEC industry, 2022 ended on a dour note, yet there is hope for 2023. The American Institute of Architects (AIA) released its Architecture Billings Index reading for December last week. The bad news is that the measure, clocking in at 47.5, indicated that billings are declining. The good news is that December was up from November's 46.6. Let's hope that this isn't a dead cat bounce. The ABI is a nine-to-twelve-month leading indicator of commercial building construction activity, with measures above 50 demonstrating that billings are increasing and those below 50 signaling a decrease. 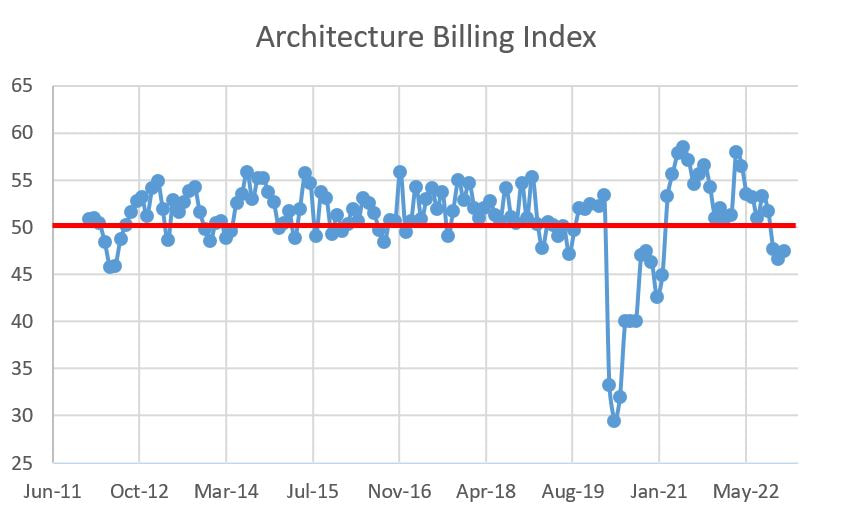 The last three monthly ABI results have come in under 50. This is not surprising given that the economy is still trying to digest information. Inflation is getting better but is still high by (recent) historical standards and economists are business prognosticators are still debating whether or not there will be a recession and, if yes, whether it will be soft or hard. The design and construction industry is feeling the whiplash of the manic economic data and while the ABI has turned down, there is still plenty of work for builders with the hope of more with funds from infrastructure bills shaking loose. Overall, the news is not great but it is note reason for panic either. 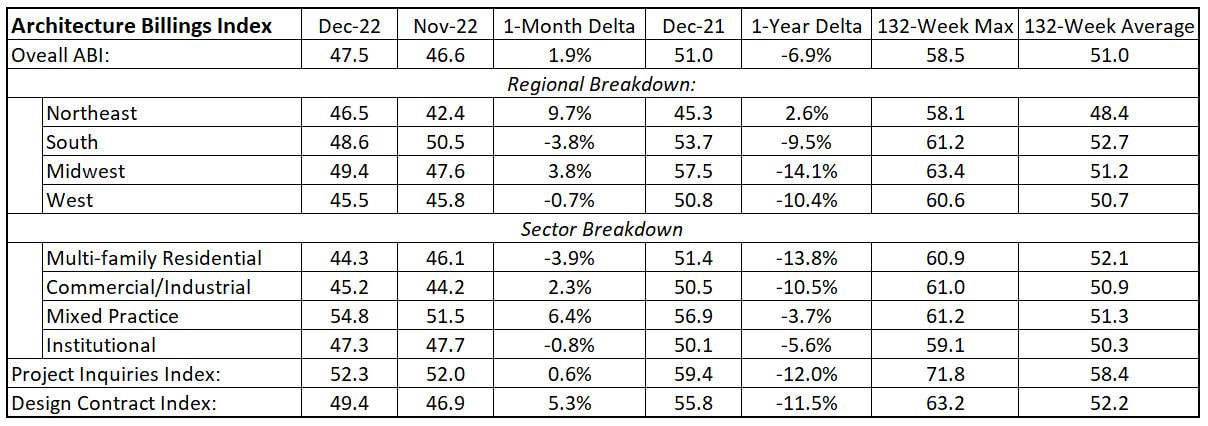 If you want to panic, here's your justification: a) save for the northeast, every regional and sectoral measure is down over the past year, and b) the most recent month's detailed data shows that regional and market segment data are all below the 132-month (11-year) averages except mixed practice. If you want a silver lining, focus on the fact that we are way up from when the design market cratered while we falling into the jaws of COVID-19 pandemic in the spring of 2020. You can see the market gyrations in the graphs below. 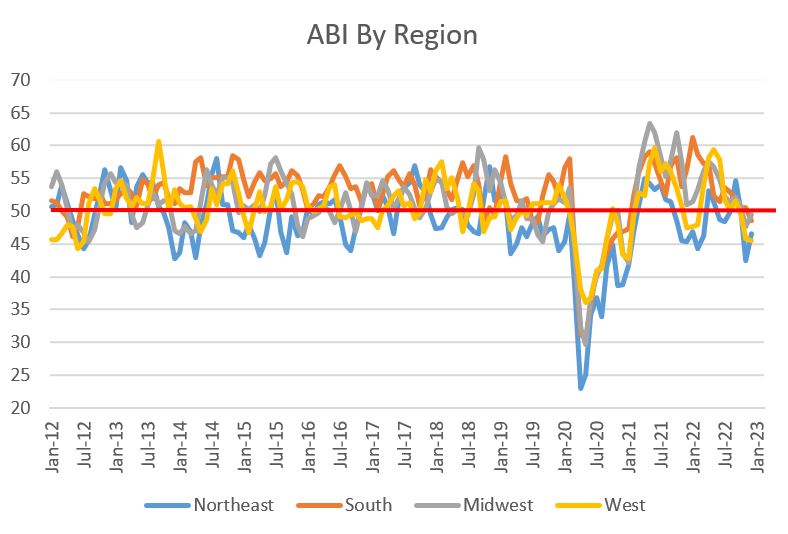 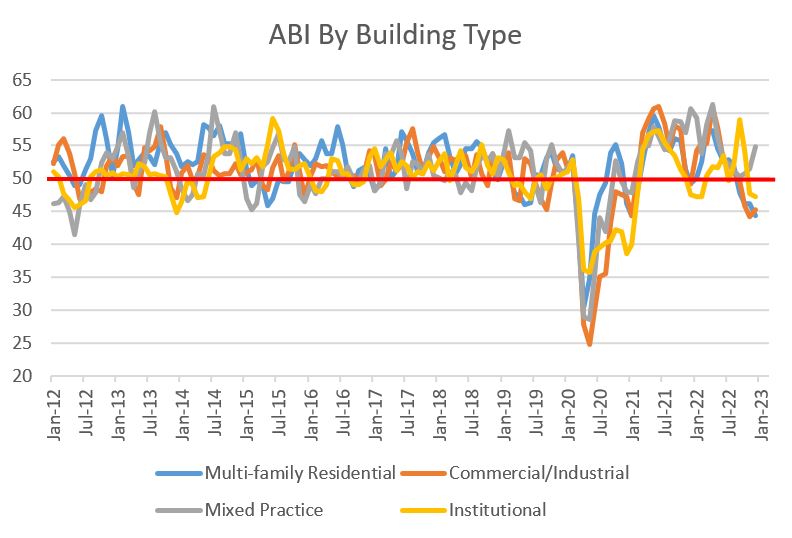 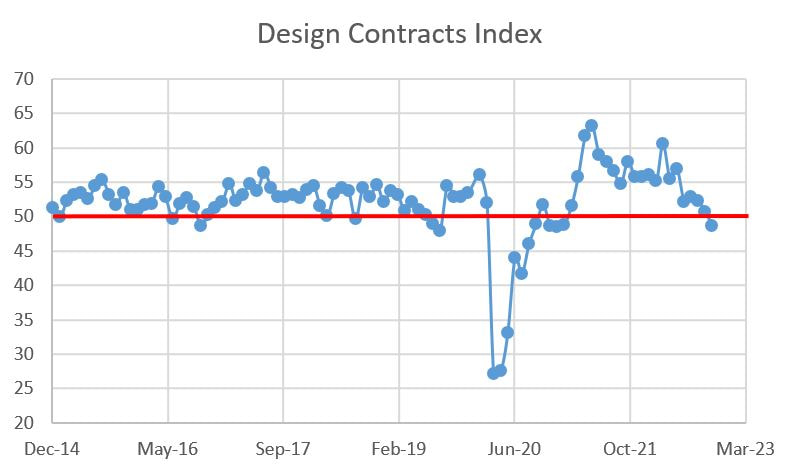 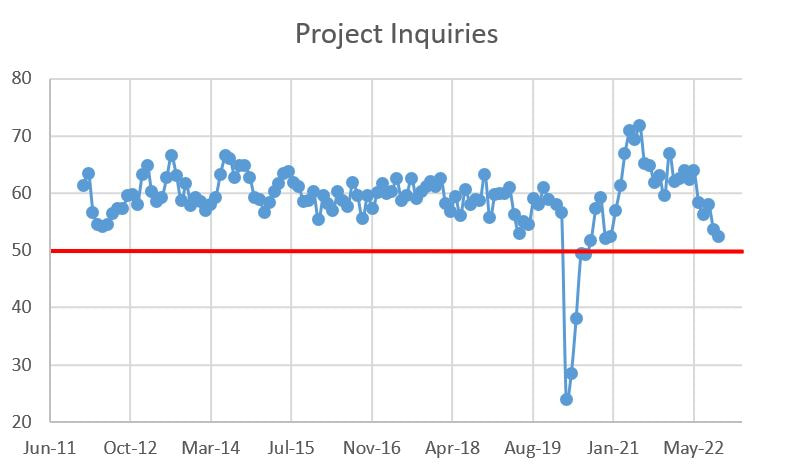
0 Comments
Leave a Reply. |
Archives
January 2024
Categories |
 RSS Feed