|
The American Institute of Architects' (AIA) Architectural Billings Index (ABI) measure for September slipped to 51.7, down from 53.3 the month prior. While this is a relatively steep drop, the losses were localized to two key areas that will be discussed below. And while the ABI slipped, it is still above 50 and is actually higher that it was in July. ABI measures above 50 mean billings are increasing, while those below 50 signal a decrease. The ABI is a nine-to-twelve-month leading indicator of commercial building construction activity. The amount of up-and-down activity in ABI is not surprising giving the gyrations in the overall economy. 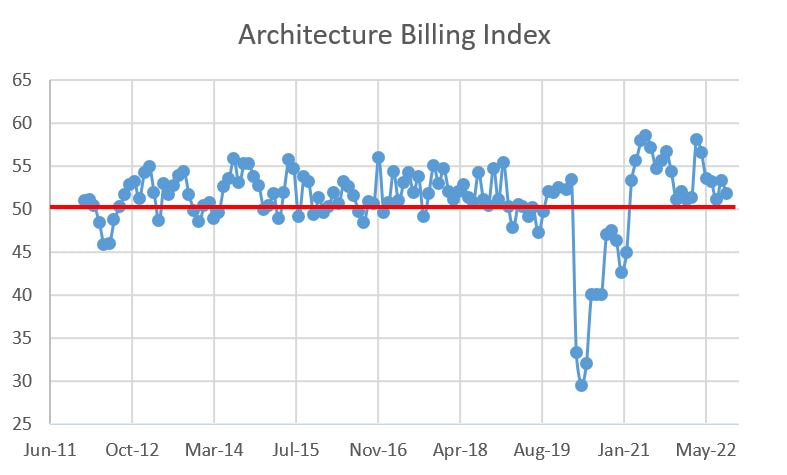 When digging into the details, what jumps out to me are the September result for the South and Multi-family residential, the two sectors that have been in their own secular bull market for quite some time.
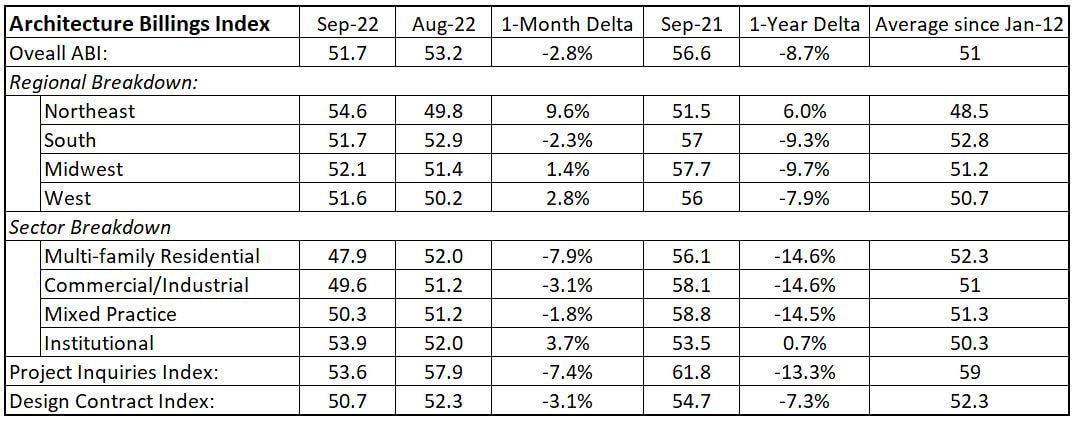 The graphical data is below, yet the big story of today is the steep slide in the South and Multi-family. That said, while ABI is a leading indicator, the more leading of the leading indicators are the Project Inquiry and Design Contract indices, and both are down on a month-over-month and year-over-year basis. Even worse, they are well below their 10+ year averages. The next few month could see even greater paring unless there is a bump from the infrastructure bills. 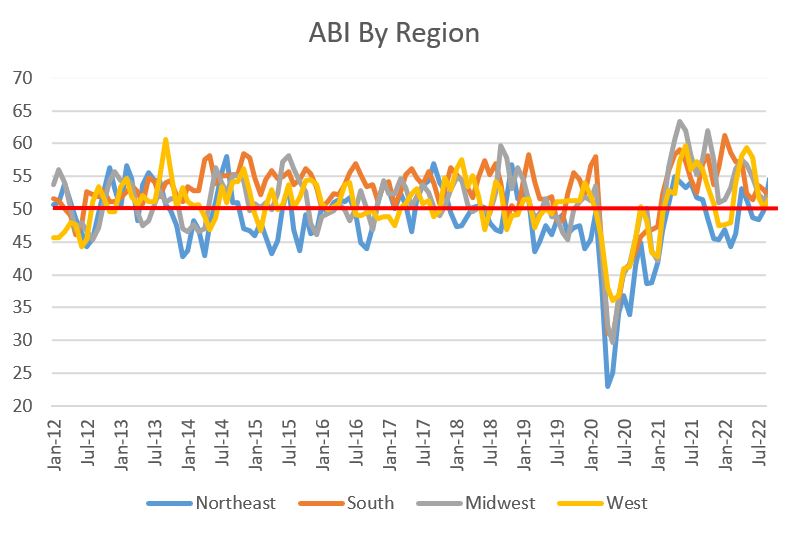 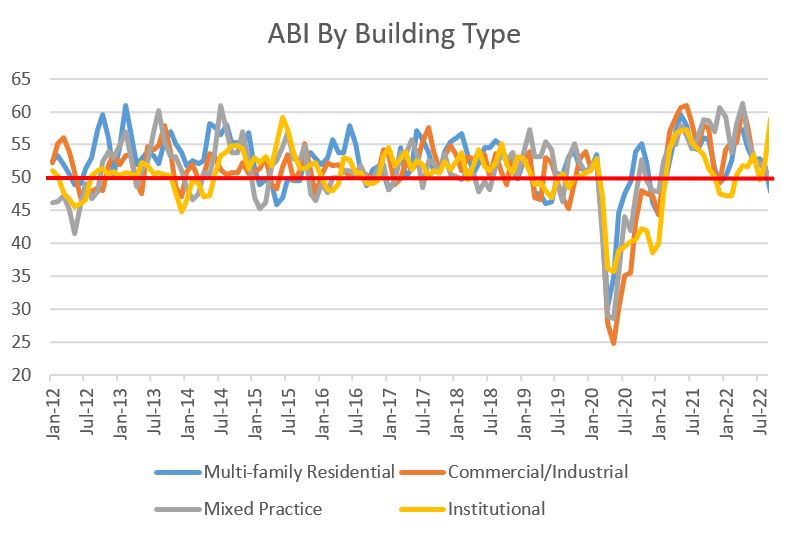 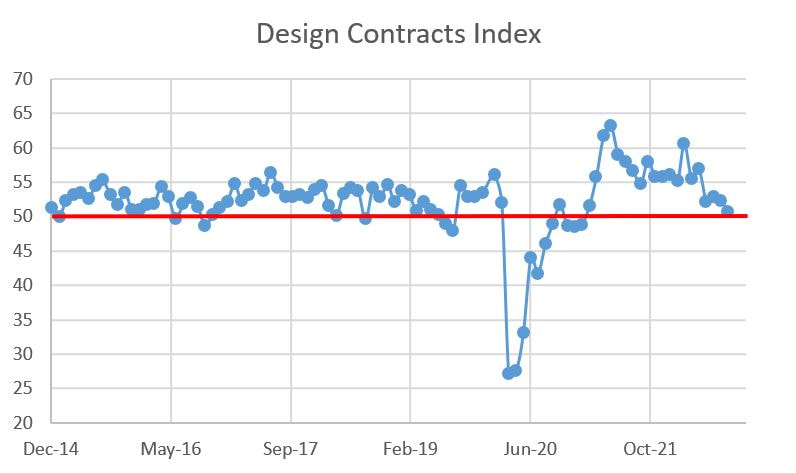 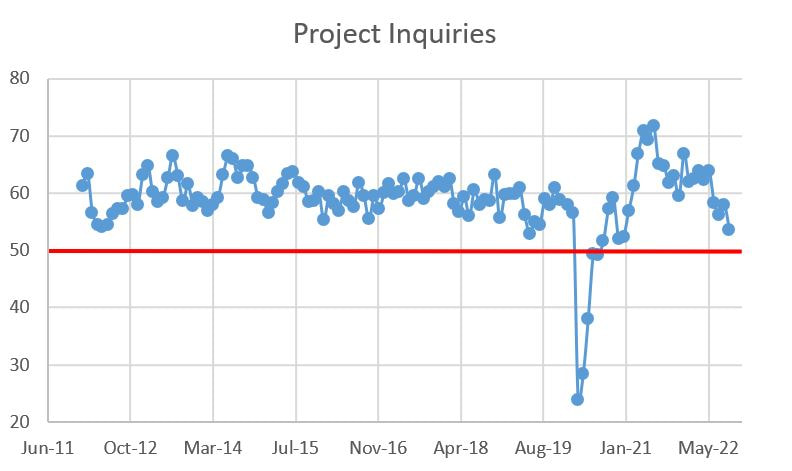
0 Comments
Leave a Reply. |
Archives
January 2024
Categories |
 RSS Feed