|
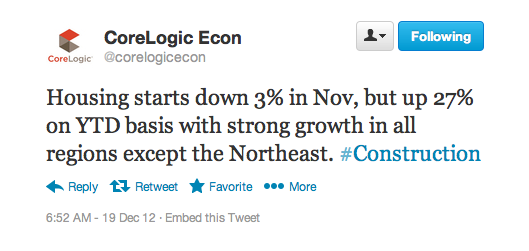
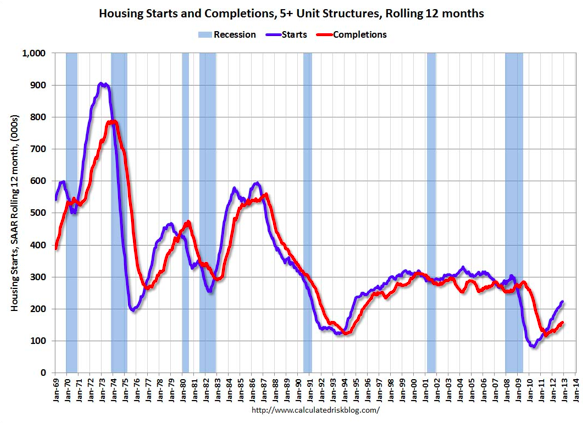
Just when I thought I was done for the year... A lot of news came out on the real estate and architectural markets, both of which are key leading indicators for the construction industry. Architectural Billings: AIA released its architectural billings index (ABI) for October today. ABI is considered a leading indicator for construction, typically leading construction activity by about a year (for more info, read this article). Here's the good news: The ABI composite was 53.2 in October, up from 52.8 in September (50 is the threshold between positive and negative billings). More good news: the ABI is above 50 across all regions in the United States. Even more good news: the ABI is above 50 in the institutional (think schools and hospitals) and residential (multi-family and high rise housing) markets. ABI for the institutional market is 51.4, up from 51.0 in September, while the ABI for the residential market is 59.6, up from 57.3 in September. But there is some bad news: the ABI for the commercial/industrial market is still below 50. Worse, it fell from 48.4 in September to 48.0 in October. Not a huge fall, but it still shows weakness. I wrote earlier today that the longer-term indicators that suggest the commercial real estate market is stabilizing and possibly getting better (note: this is my assessment of the commercial real estate market, not architectural billings or the construction industry). But in the near term, ABI is contracting for commercial/industrial projects, which means the construction industry surrounding the commercial/industrial market may still have some pain to experience. Below is the full take of AIA (full version can be found here and the press release can be found here):  As the bottom of the graphic shows (and I've mentioned plenty of times before), some of the weakness in the market is due to "uncertainty" in the economy. Corporations and large investment funds have tons of cash on the sidelines, but they won't invest it until they feel better. What will make them feel better is anyone's guess. Single Family Housing: I said earlier today that I wasn't as interested in single family housing because I'm more interested in projects that involve larger commercial general contractors. However, as previously mentioned, single family housing is a leading economic indicator for the U.S. economy in general (i.e. not just the construction industry). There was a lot of interesting data presented today. First the bad news (or maybe the not-as-good news). Mortgage applications decreased 12.3 percent from the previous week according to data collected by the Mortgage Bankers Association (see press release here). CoreLogic also tweeted that housing starts were down 3% in November (CoreLogic doesn't have any data backing that figure up on their webpage, but let's assume the tweet is correct). Taking both of these data points together (again, one I cannot fully substantiate), it shows that the housing market maybe showing some slight signs of weakness. Let me be clear: mortgage applications and housing starts are not the same thing. But housing starts and mortgage applications both are a function of demand. It could be that demand is slackening, at least in the recent past. The good news, however, is boffo good news. CoreLogic, in the same tweet (which again, the data behind it has not been substantiated) states that housing starts are up 27% year-to-date with strong growth in all regions with the exception of the Northeast. Bill McBride at the Calculated Risk blog states that housing starts are on pace to increase 25% in 2012 (I'm not sure where Mr. McBride got his data, but you can see his blog post here). Interesting, Bill goes on to point out that the 770,000 housing starts in 2012 will be the 4th lowest total since 1959, which is when the Census Bureau started collecting such data (the three lower years being those between 2009 and 2011). It shows we're emerging from a pretty big crater. Bill was full of interesting data today: The upper graph shows housing starts and completions for multi-family housing. There are two interesting takeaways from the data. First, the data is trending positively. Secondly (and this I'll admit I'm hoping my students will see) is that there is a one-year lag between starts and finishes. That's because it takes approximately one year to complete multi-family projects (obvious the size of the project/number of units also impacts the schedule).
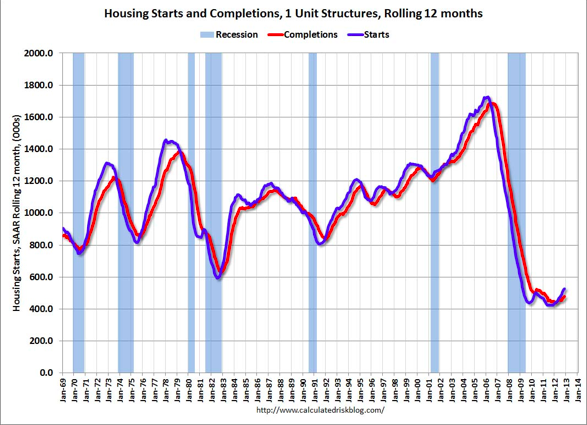
The second graph shows starts and completions for the single family housing market. It's also tending positively (albeit much more muted than multi-family). The lag between starts and finishes, however, is only six months which, not so coincidentally, is the approximate amount of time necessary to build a single family home. Bottom lines: 1) Architectural billings are up, and that's a good sign for the construction industry. There's still some weakness in the commercial/industrial market, but the other markets are positive and strengthening. 2) there is some recent signs of weakness in the single family housing market, but the last 12 months have been a home run. Hopefully these very recent trends are an anomaly, because as the housing market strengthens, confidence in the general economy increases. And that is also a good thing for the construction industry.
1 Comment
|
Archives
January 2024
Categories |


 RSS Feed