|
I read an interesting article in the McKinsey Quarterly this weekend regarding construction employment. Almost everyone in the Architecture-Engineering-Construction (AEC) industry knows there is a labor shortage, acutely for skilled trade positions. What I found particularly interesting is that the demands for such labor will increase markedly over the next few years as projects funded by H.R.3684 - Infrastructure Investment and Jobs Act (IIJA) commence. As of September 2022, there were approximately 7.7 million people working in the construction industry. 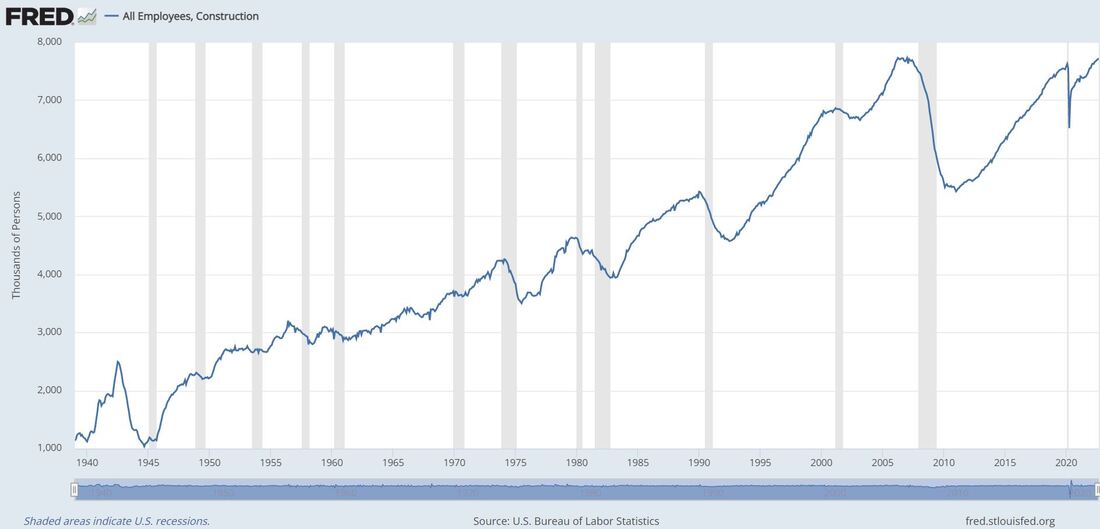 This amount is just slightly less than the peak construction employment achieved in April 2006 (7.719 versus 7.726 million to be more precise). However, the gains in employment since the market cratered in the housing bust that catalyzed the great recession of 2007-2008 are not enough. There are currently over 440,000 openings in the construction industry. 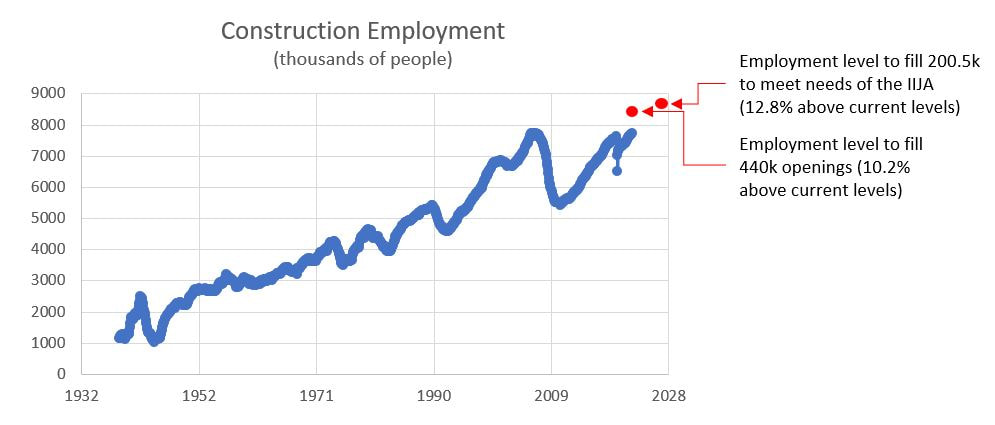 If those open positions are to be filled, we need to increase construction employment by over 10%. But that’s not all. The McKinsey article estimates that we will need over 200,500 additional positions between 2027 and 2028 to accommodate the projects that will be funded by the IIJA. Most of these jobs will be in areas that most people associate with traditional infrastructure, such as:
Yet, the biggest increase in employment will be necessary to build broadband infrastructure (9,100 engineering positions and 35,000 trades workers). These totals do not include people in the industries tied to delivering construction materials, which is in even greater need. The McKinsey article offers some recommendations for increasing construction employment (upskilling/reskilling existing workers, hire from nontraditional segments e.g. military, enticing people into the workforce with subsidized housing and other benefits e.g. childcare, and of course apprenticeships. Another key point to entice people into the construction industry is the pay. Strong demand for people for the foreseeable future and steadily increasing compensation are great selling points. However the case is made, it needs to be made strongly, because the construction industry is understaffed just as we are finally making serious investments in our built environment. 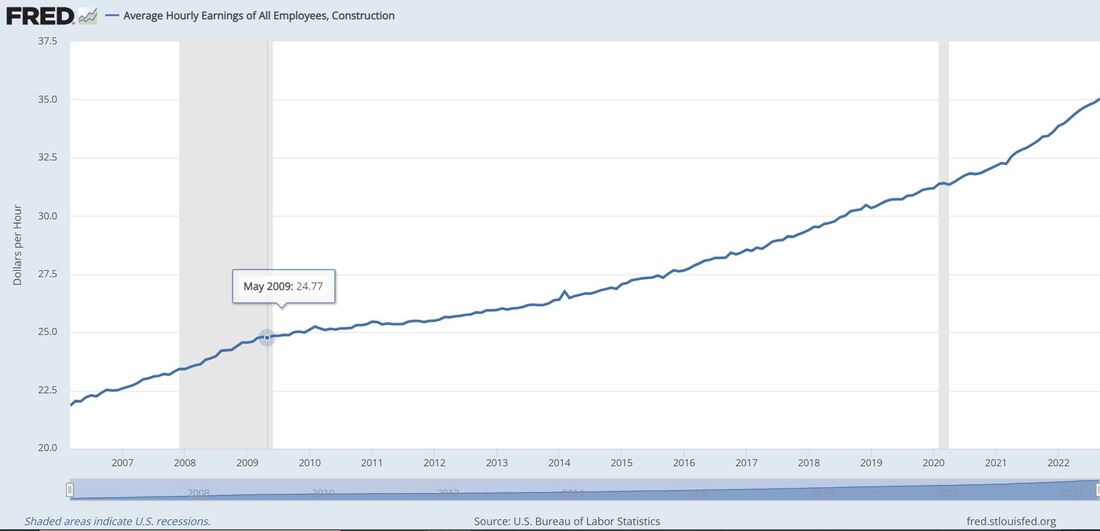
0 Comments
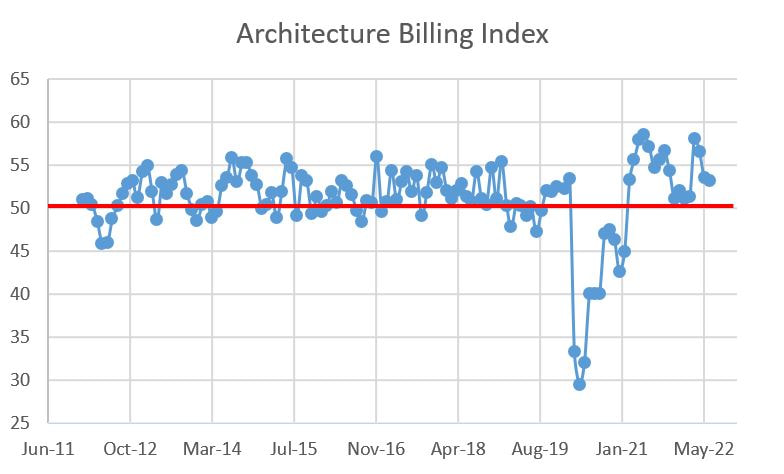
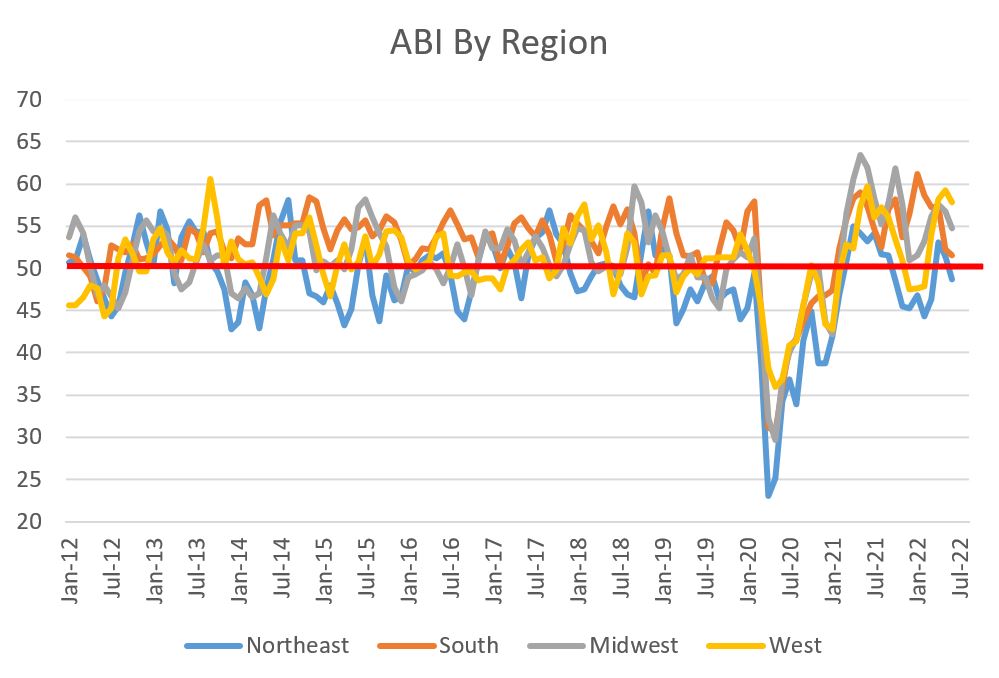
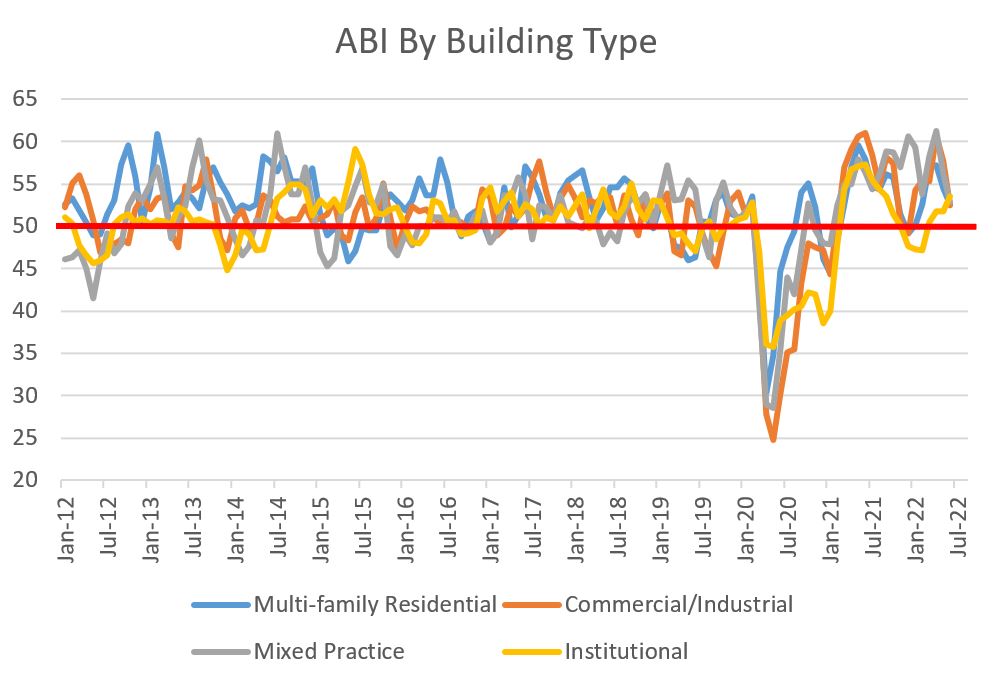
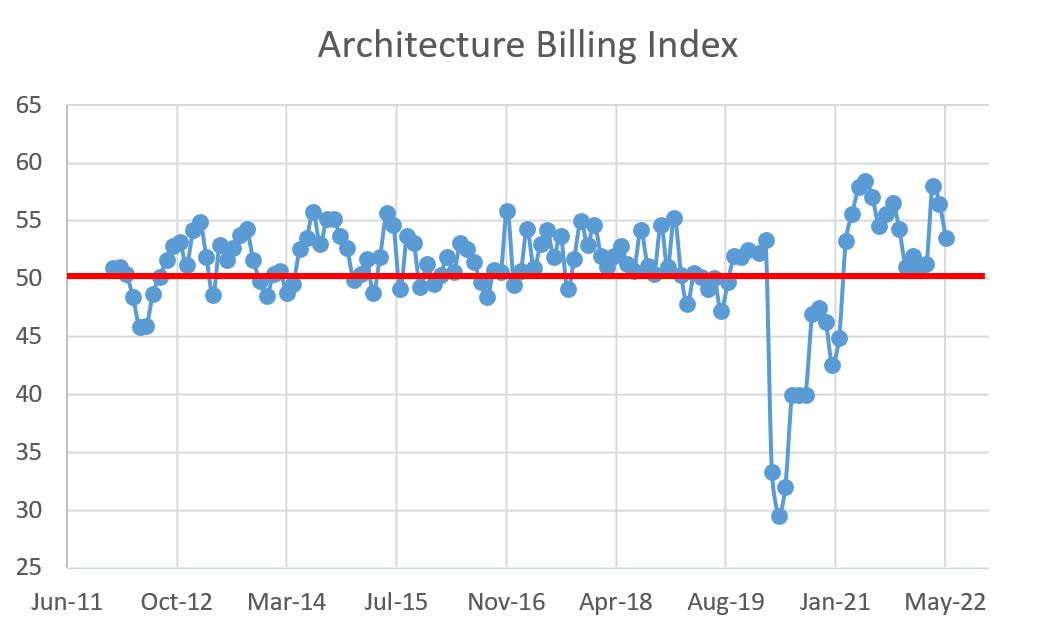
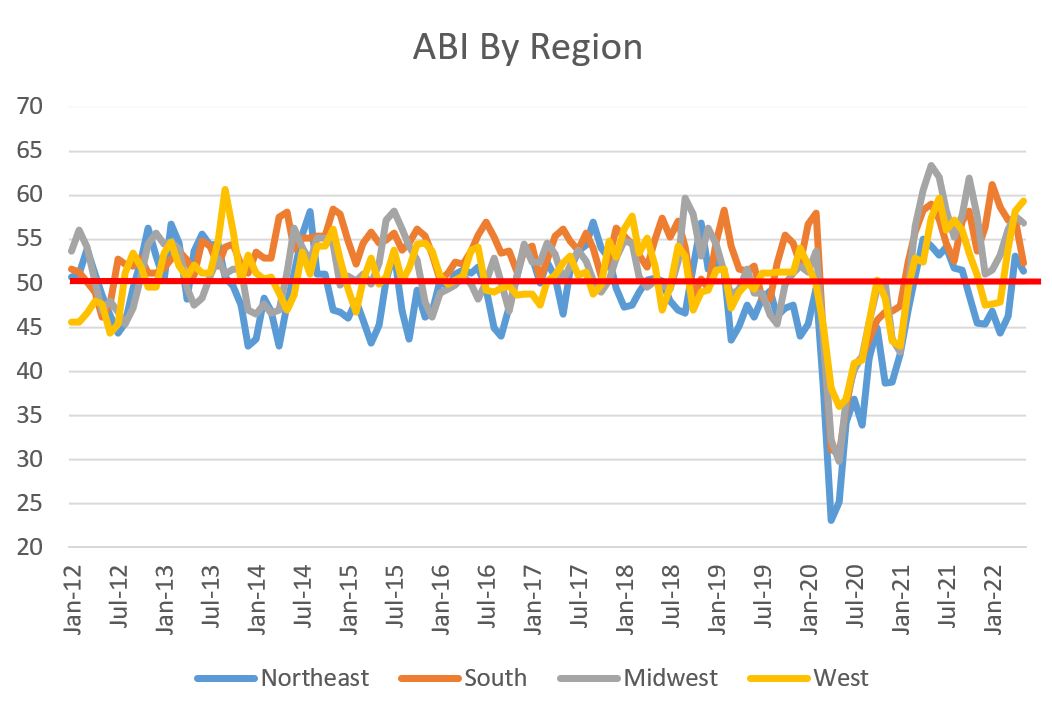
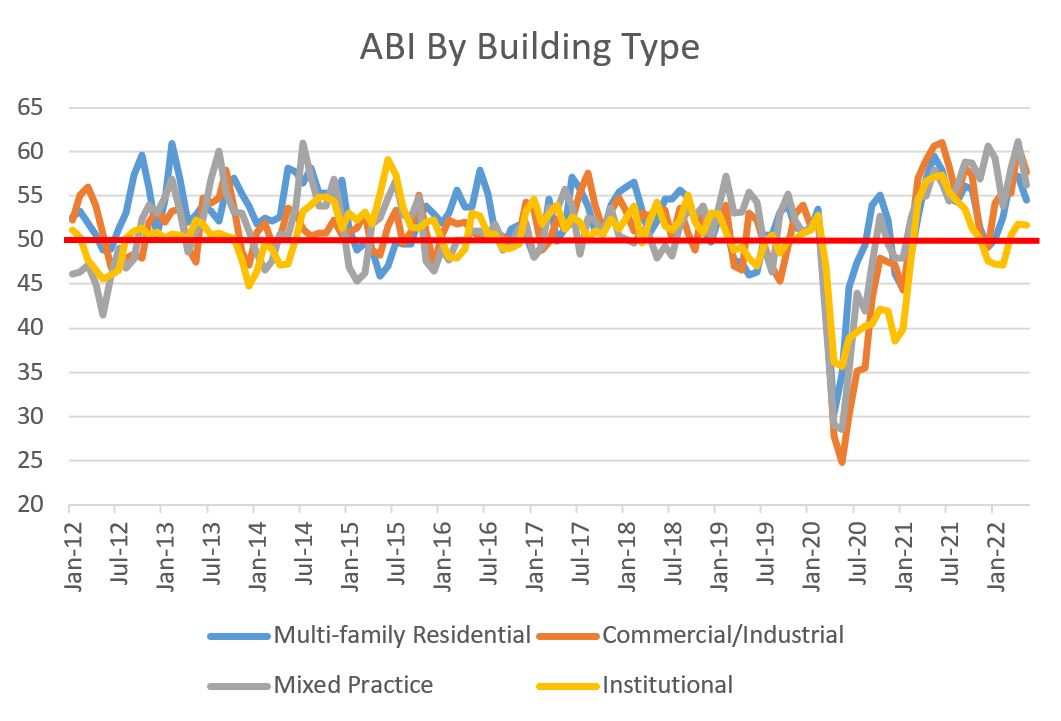
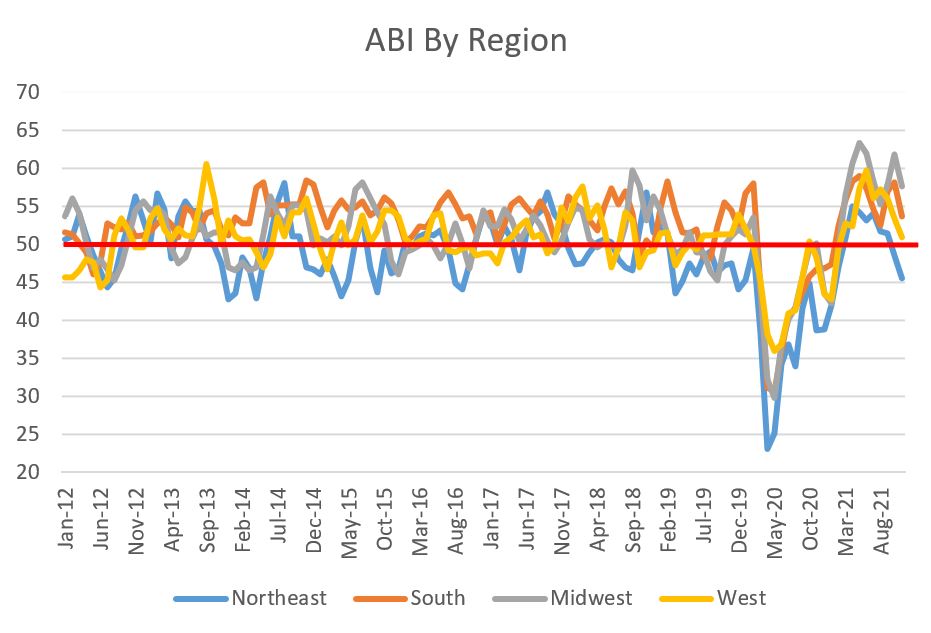
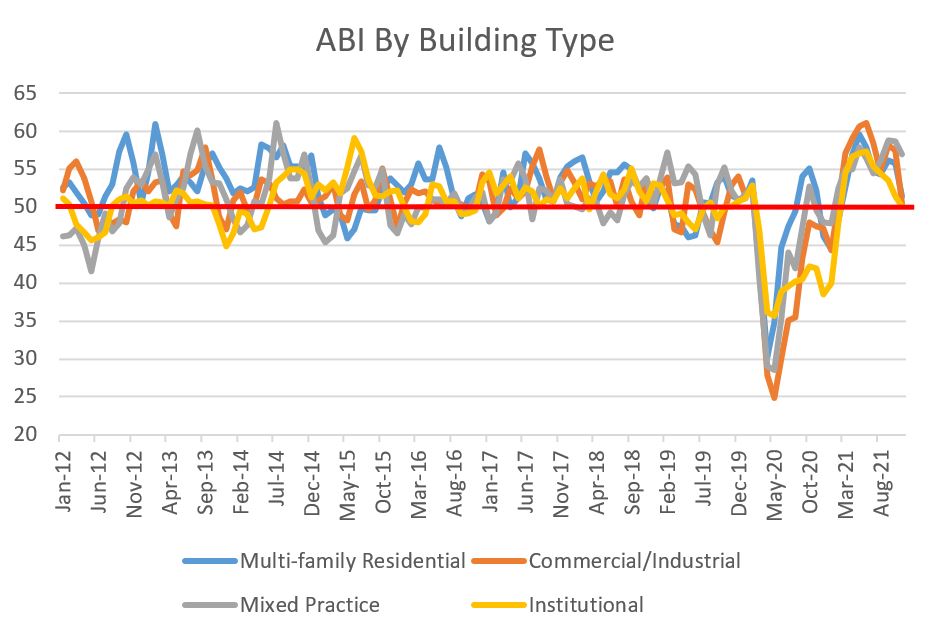
The American Institute of Architects' (AIA) Architectural Billings Index (ABI) measure for September slipped to 51.7, down from 53.3 the month prior. While this is a relatively steep drop, the losses were localized to two key areas that will be discussed below. And while the ABI slipped, it is still above 50 and is actually higher that it was in July. ABI measures above 50 mean billings are increasing, while those below 50 signal a decrease. The ABI is a nine-to-twelve-month leading indicator of commercial building construction activity. The amount of up-and-down activity in ABI is not surprising giving the gyrations in the overall economy. 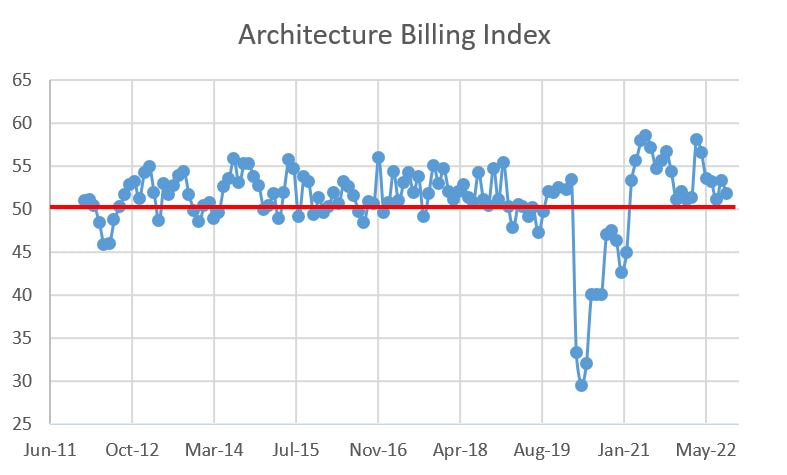 When digging into the details, what jumps out to me are the September result for the South and Multi-family residential, the two sectors that have been in their own secular bull market for quite some time.
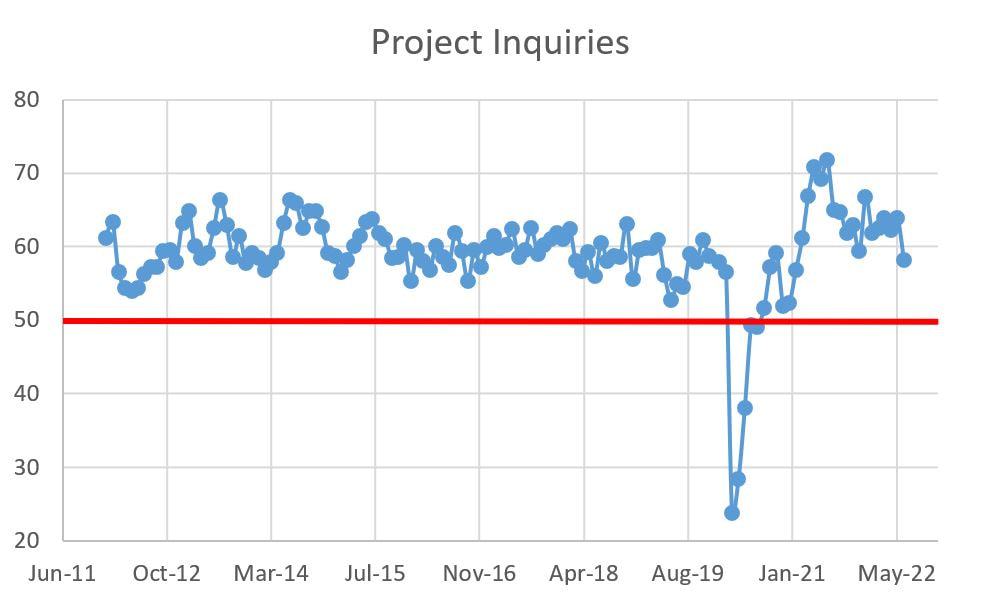
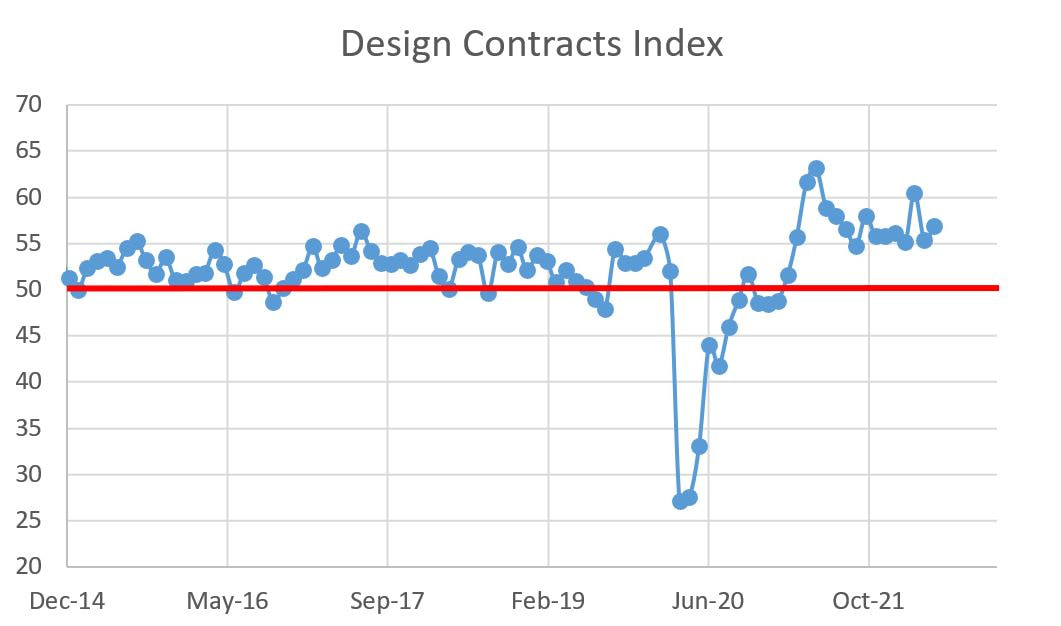
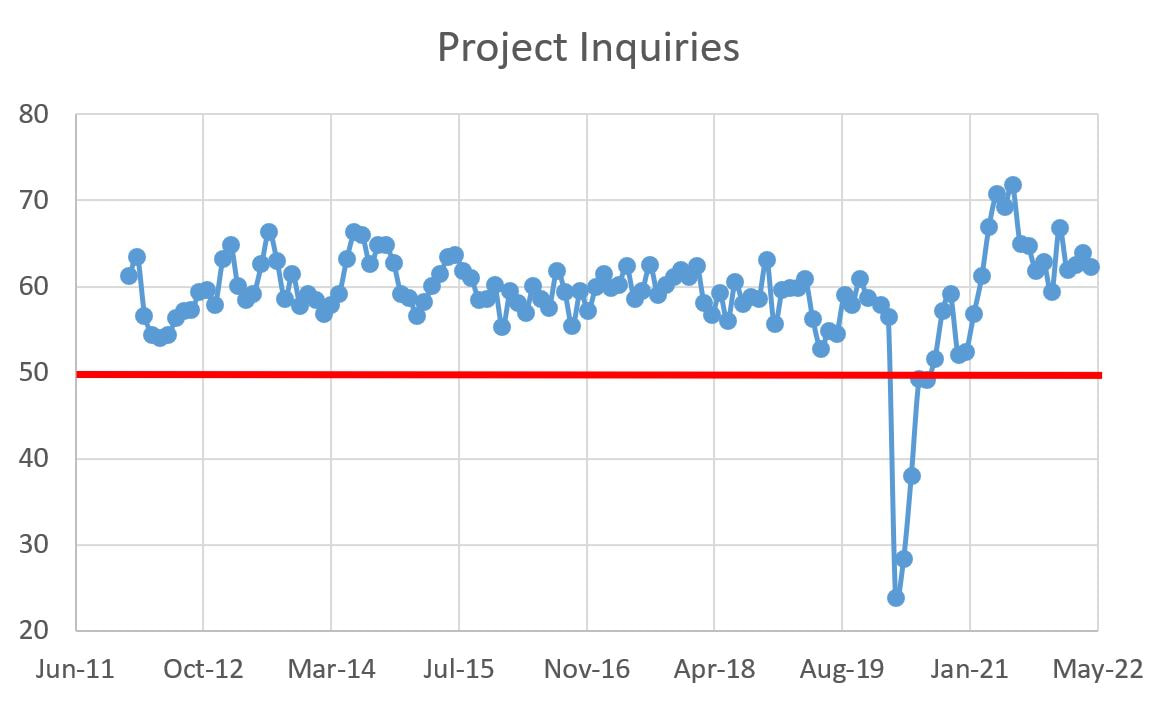
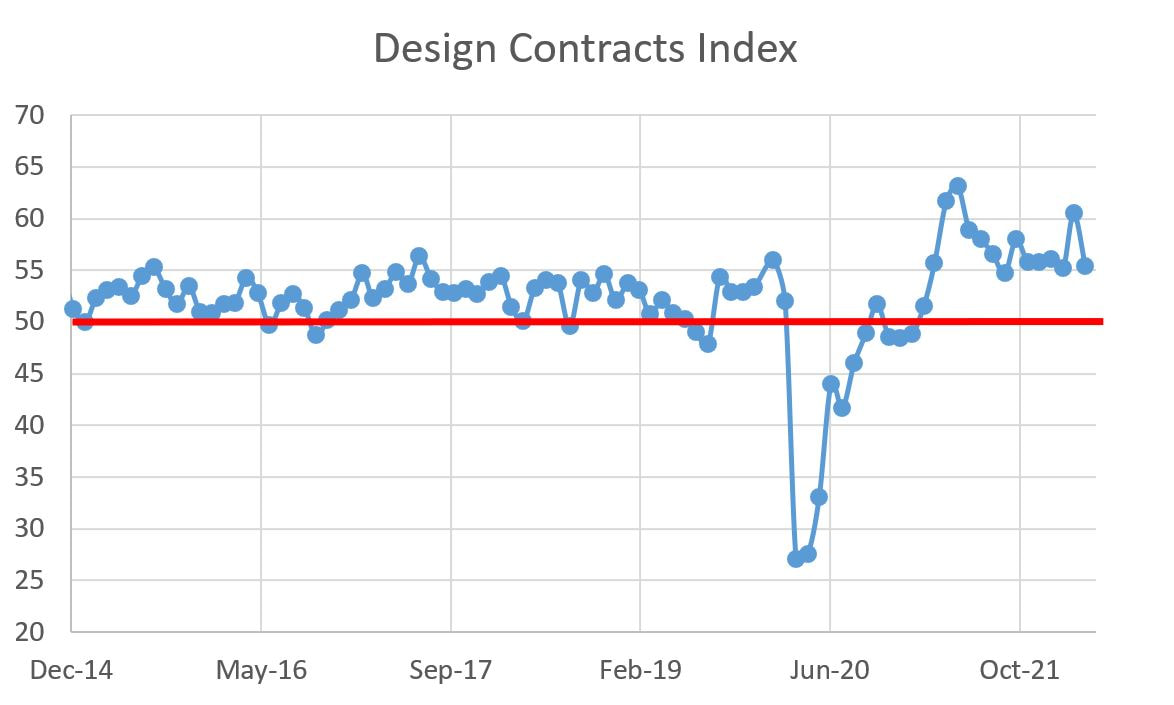
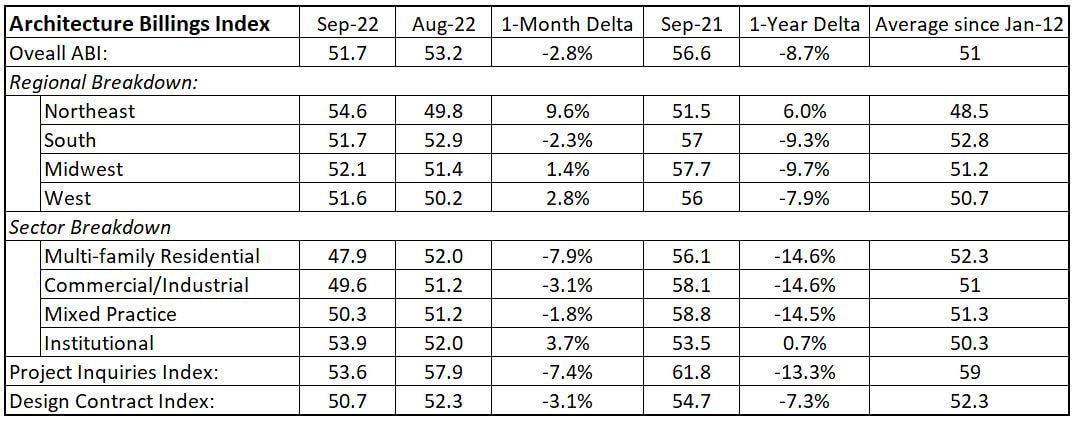 The graphical data is below, yet the big story of today is the steep slide in the South and Multi-family. That said, while ABI is a leading indicator, the more leading of the leading indicators are the Project Inquiry and Design Contract indices, and both are down on a month-over-month and year-over-year basis. Even worse, they are well below their 10+ year averages. The next few month could see even greater paring unless there is a bump from the infrastructure bills. 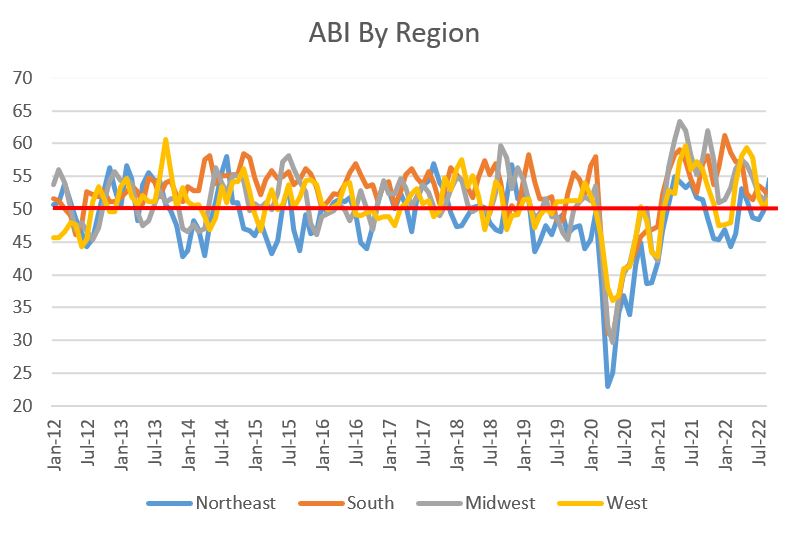 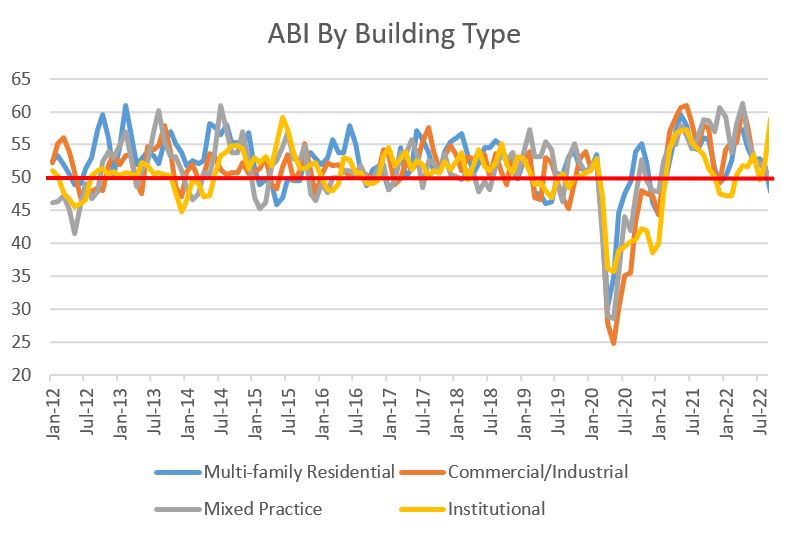 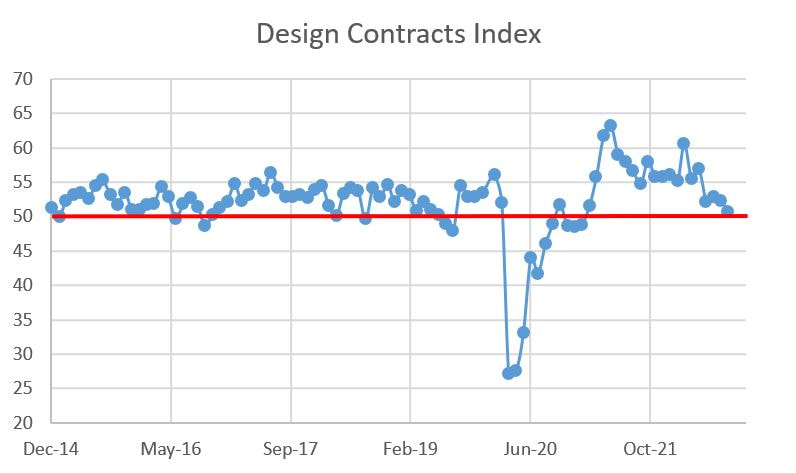 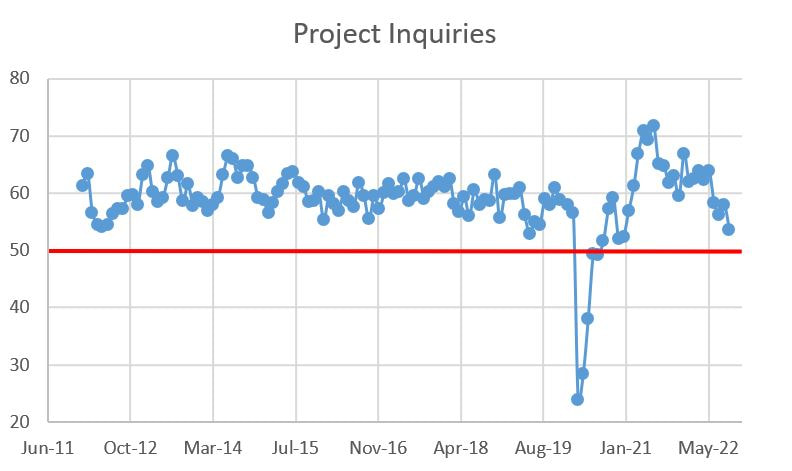 Architecture Billings Are a Mixed Bag, But At Least They Are Performing Better Than the Stock Market9/26/2022 It has been two months since I have posted regarding the American Institute of Architects' (AIA) Architectural Billings Index (ABI). In that two months, the Dow and S&P 500 are down over 9% and the NASDAQ is down over 6%, with the bulk of these drops in the form of market convulsions based on the Fed raising interest rates. Layer this on top of 40-year high inflation and the sundry labor and supply chain issues and you have a cocktail for malaise. However, over that same period of time, the ABI is actually up, albeit by less than 1%. The August ABI registered at 53.3, versus 51 in July and 53.2 in June. But up is up, so keep that in mind before the other shoe drops. Recall that measures above 50 mean billings are increasing, while those below 50 connotate a decline in billings. The ABI is a nine-to-twelve-month leading indicator of commercial building construction activity. As for that other shoe...there is a lot of negative numbers, both from month-over-month ABI data and year-over-year. The details are as follows, but first a few notes:
Per usual, it will be important to watch the ABI and other metrics (e.g. construction material costs and labor rates) as the economy continues to navigate choppy waters. I suspect the measures will decline more next month given the sense of pessimism on Wall Street, but I hope I am wrong. There is a bit of distance between Wall Street and market demand. 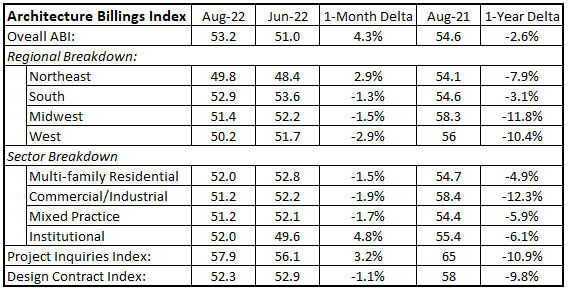 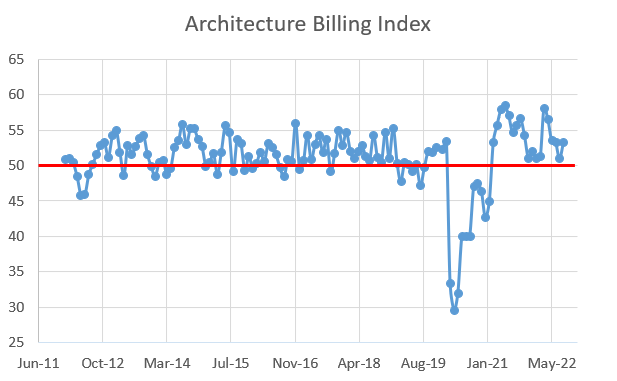 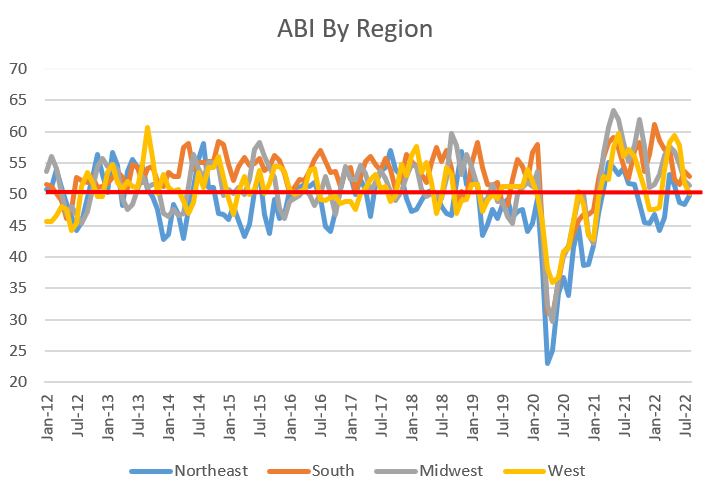 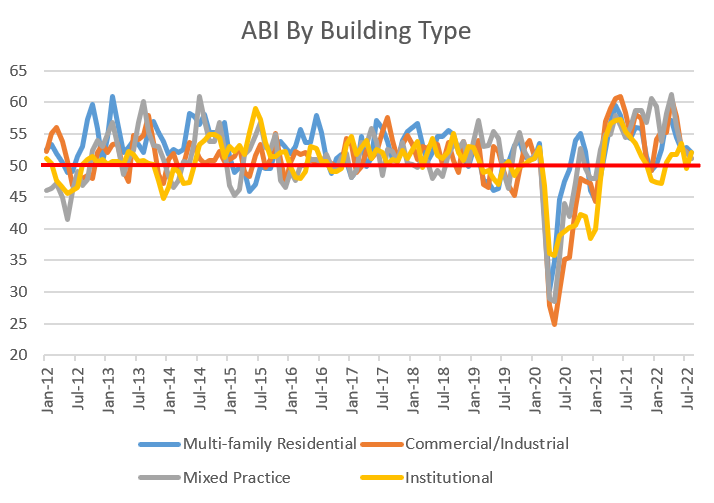 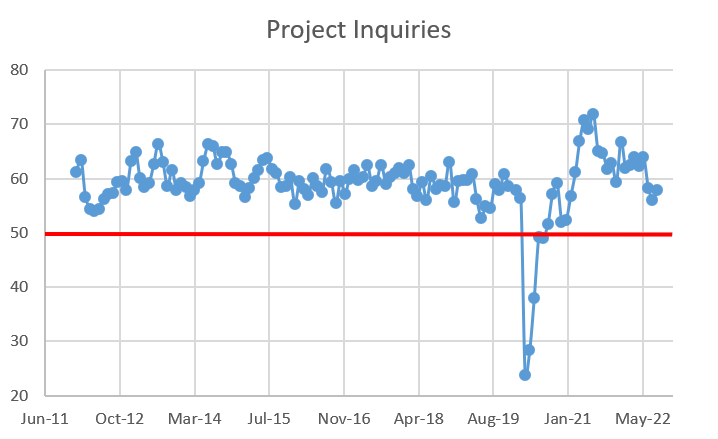 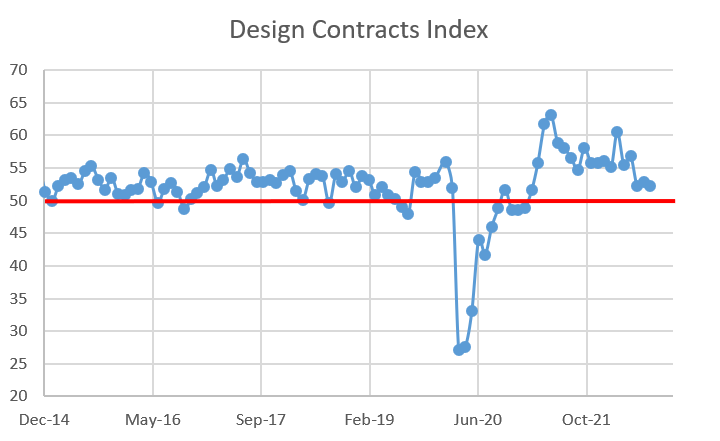 If you think the above title sounds like I am hedging, trust your instincts. Since I tend to be pessimistic, I am going to throw a curve ball and lead with the good news: the Architectural Billings Index (ABI), as compiled by the American Institute of Architects (AIA), registered as 53.2 in June 2022. Measures above 50 mean billings are increasing, while those below 50 connotate a decline in billings. The ABI is a nine-to-twelve-month leading indicator of commercial building construction activity. The negative flip side to the news is that the ABI declined from May, which is the fourth straight month of declines. Furthermore, all of the subset data except one have declined month-over-month and all declined year-over-year. Enough negativity...let's tack back to the positive. While declines are rarely good news, particularly with terms like "recession" being bandied about, a little perspective can be applied in terms of the AEC industry being incredibly busy for almost a year and a half. Given the multiple woes of labor availability, supply chain issues, COVID, interest rate hikes etc., etc., a little slowing will allow designers and builders an opportunity to find some firm footing to complete projects. The details of the most recent data is below, there are a few things I want to point out:
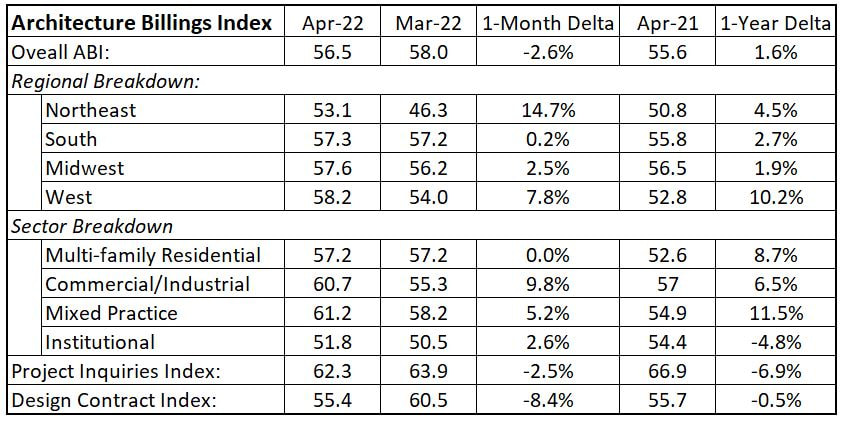
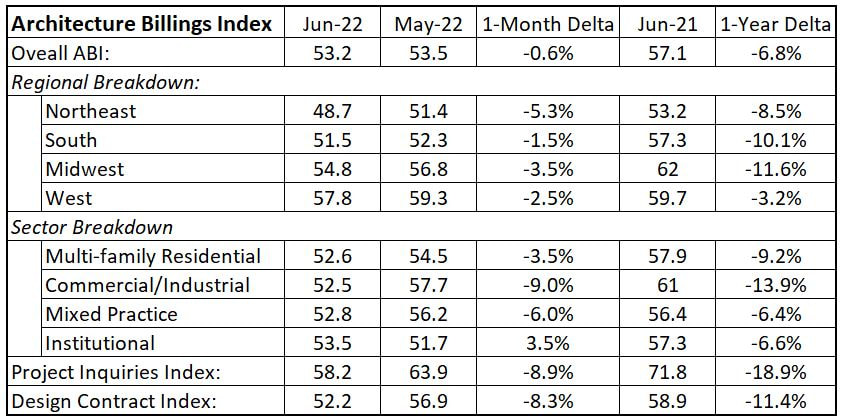      S&P 500 is down 5% over the past month. Bitcoin is down 33% month-over-month. And in spite of my slightly misleading title, the American Institute of Architects (AIA) Architecture Billings Index (ABI) declined 5% from last month, BUT there is a huge caveat: the ABI is still positive which means billings continue to increase. The ABI is a nine-to-12 month leading indicator of commercial construction activity, with values greater than 50 signifying increasing design billings and values less than 50 signifying a decrease. So while the ABI declined from 56.5 in April to 53.5 in May, 53.5 is <checks notes> greater than 50, so billings are increasing. Architects continue to be busy which means builders should remain proportionately as busy for the next year. Here are my hot takes with the full details following:
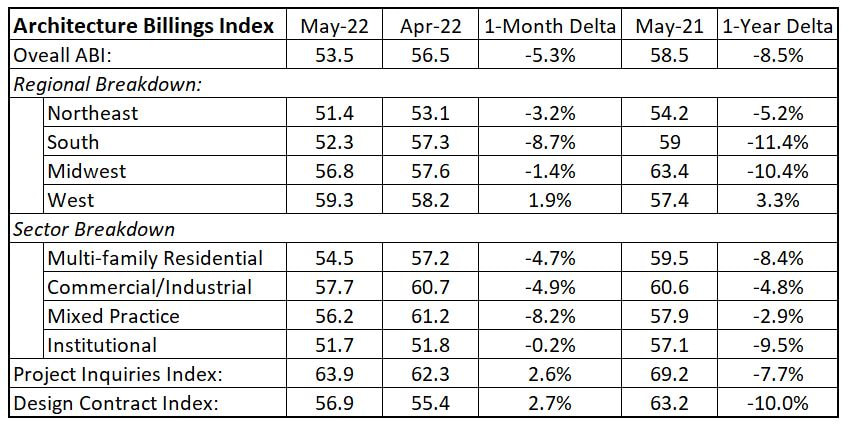      The American Institute of Architects (AIA) Architecture Billings Index (ABI) clocked in at 56.5 in April, which is down from 58 in March. I report that with two huge caveats. First, 56.5 is historically pretty good, way above the 10+ year average of 51. Secondly, and more importantly (yet statistically confusing), all of the individual ABI measures were up from last month. I am not sure how that can happen (statistical anomaly? Voodoo?), but the net takeaway is that the design sector for buildings is pretty strong. This is good news for builders as the ABI is a nine-to-12 month leading indicator of commercial construction activity, with values greater than 50 signifying increasing design billings and values less than 50 signifying a decrease. The details are below but I have a few observations:
      I could not tell heads from tales this morning as I scrolled through my e-mail. In today's installment of the Construction Dive daily brief, there were two articles that seemed to be talking in circles:
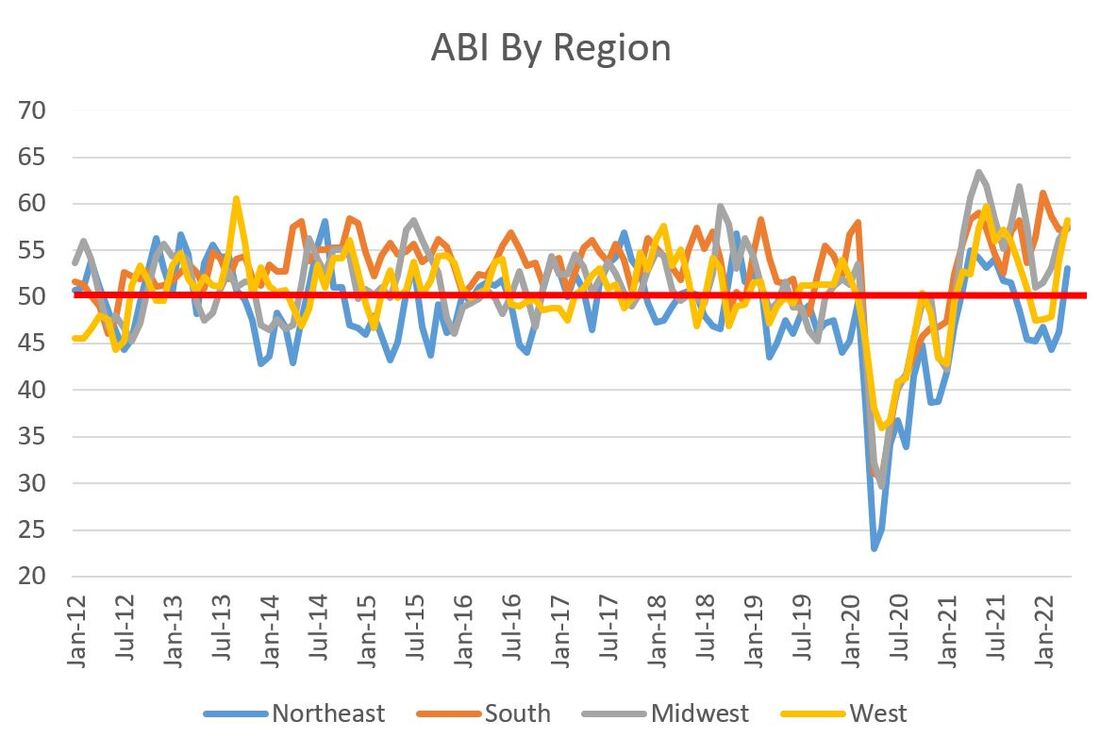
So what is going on? In reductive terms, there is a lot of pent up demand for structures, particularly housing, and contractors are very busy. However labor and materials are both hard to get and expensive when found. This tension showed itself in the past four months' worth of Architectural Billings Data published by the American Institute of Architects (AIA). The Architecture Billings Index (ABI), a nine-to-12 month leading indicator of commercial construction activity, bounced along the low 50's from November to February (51/52/51/51.3 for those of you keeping score at home). Recall that values greater than 50 signifying increasing design billings and values less than 50 signifying decreasing billings. So four straight months of low 50's indicates modest and measured growth. So after reading today's (and the last month's) news, imagine my surprise when the March ABI, which was published today, came in at a very robust 58. This is the highest the ABI has been since May of last year and is way up from February's aforementioned 51.3. The summary and graphs are shown below, but the good news was spread far and wide and was particularly good for those of us in the West, which saw a jump of 12.7% from last month. The only month-over-month declines were a very modest decline in commercial billings and billings in the South (please note that the South has been on such a tear that this decline is the equivalent of someone taking a few seconds to catch their breath after a 100-yard wind sprint. In other words, totally ordinary). There are more declines in the year-over-year data, but those of you who have not been actively trying to forget the past year or so, you may recall that a year ago the market was muy en fuego after rising like a phoenix from the depths on the COVID-induced ABI chasm of two years ago. My simplistic view of the construction economy goes like this: COVID caused a tailspin in ABI, but once vaccines and a semblance of heard immunity was realized, the industry remembered we still need housing and other structures so the market roared back. Labor and supply chain constraints have cooled the temperature and forced modest growth over the past quarter or so, with March being a seemingly randomly strong month. I actually like this tension between strong demand and labor and material constraints because it keeps us questioning our assumptions. Every owner keeps ensuring their projects still pencil and contractors keep watching construction budgets like hawks. This tension did not exist in 2007 and high demand, easy capital, no constraints, champaign and cocaine (metaphorically speaking) all merged together and ended in a housing bust that was felt around the world. By themselves, I am not a fan of rapidly escalating labor and material prices, but I feel like they are pumping the brakes and keeping us from running off the road. Anyway, enough musing. The data is below: 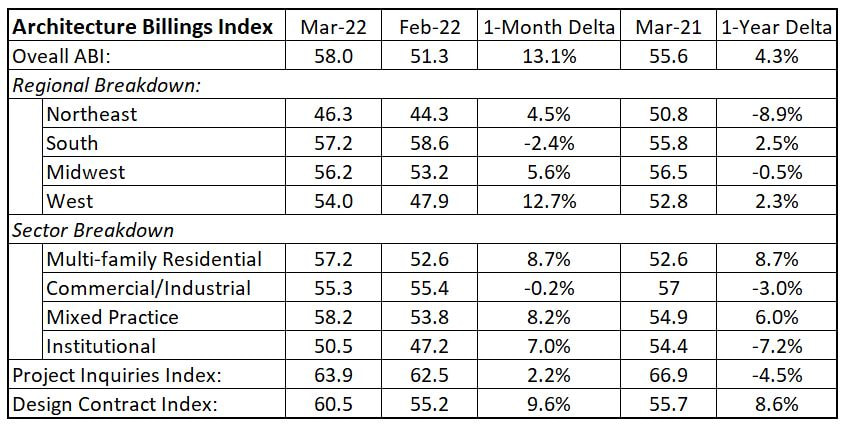 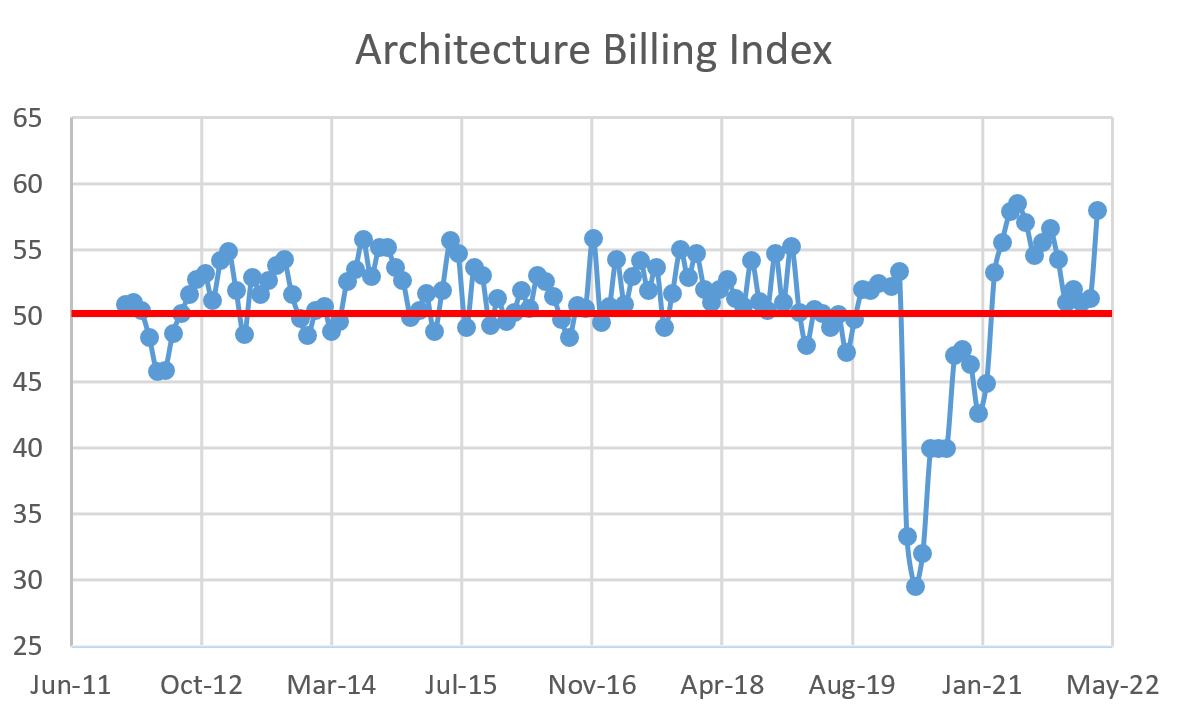 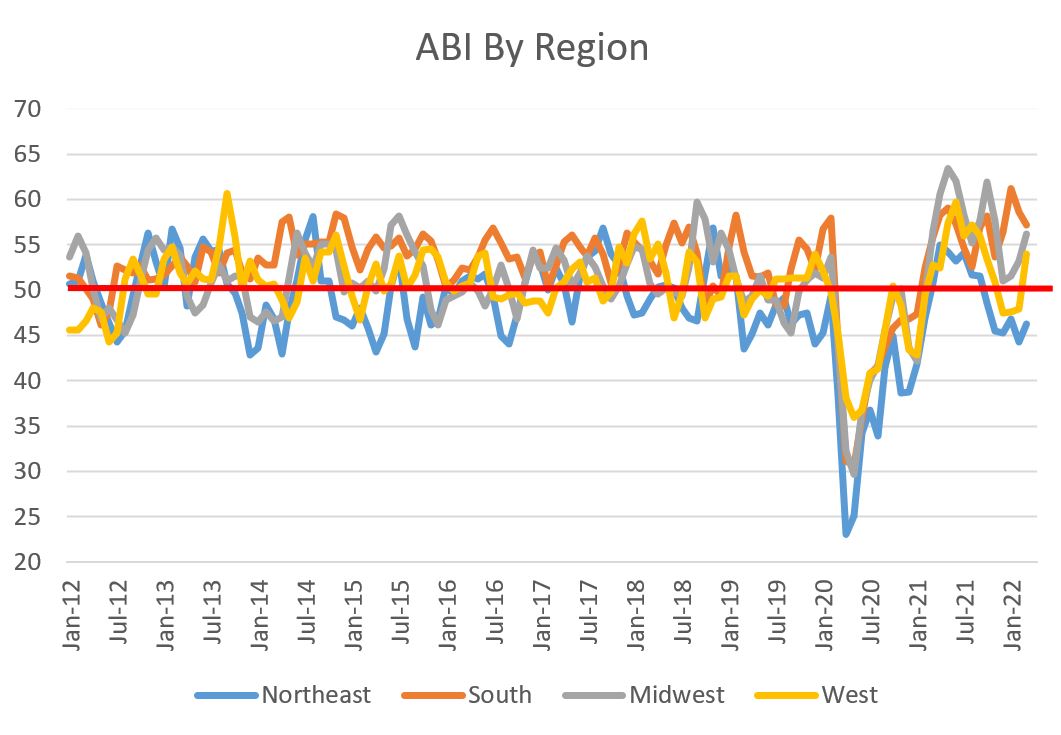 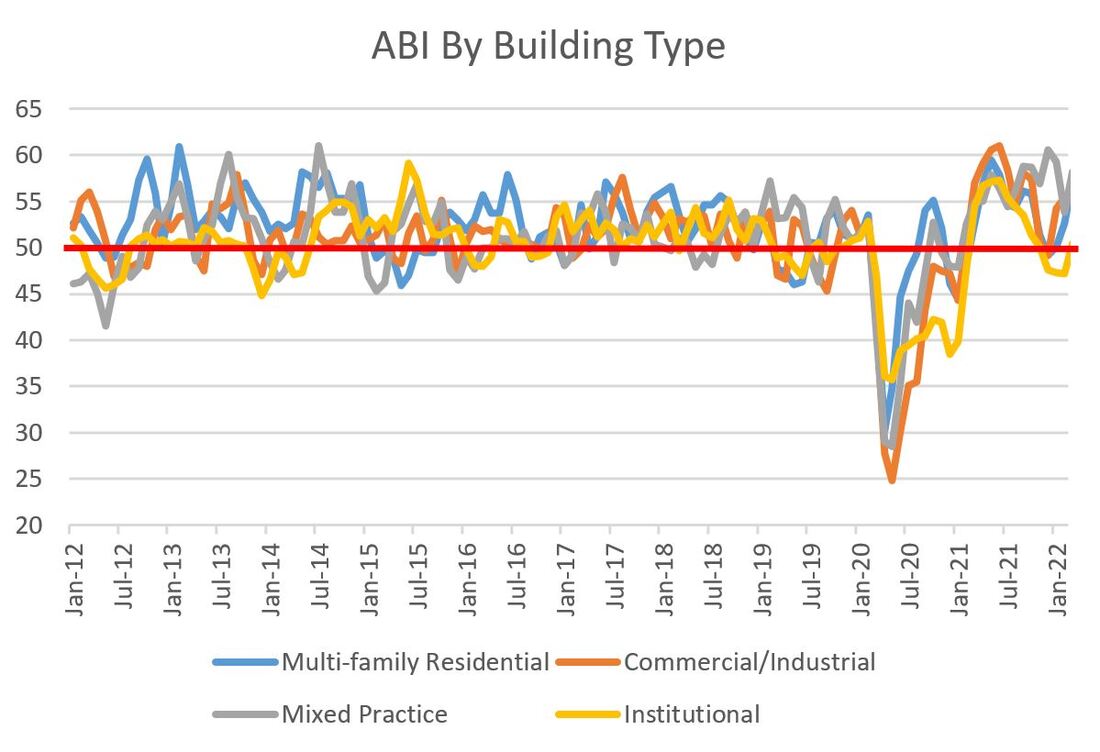 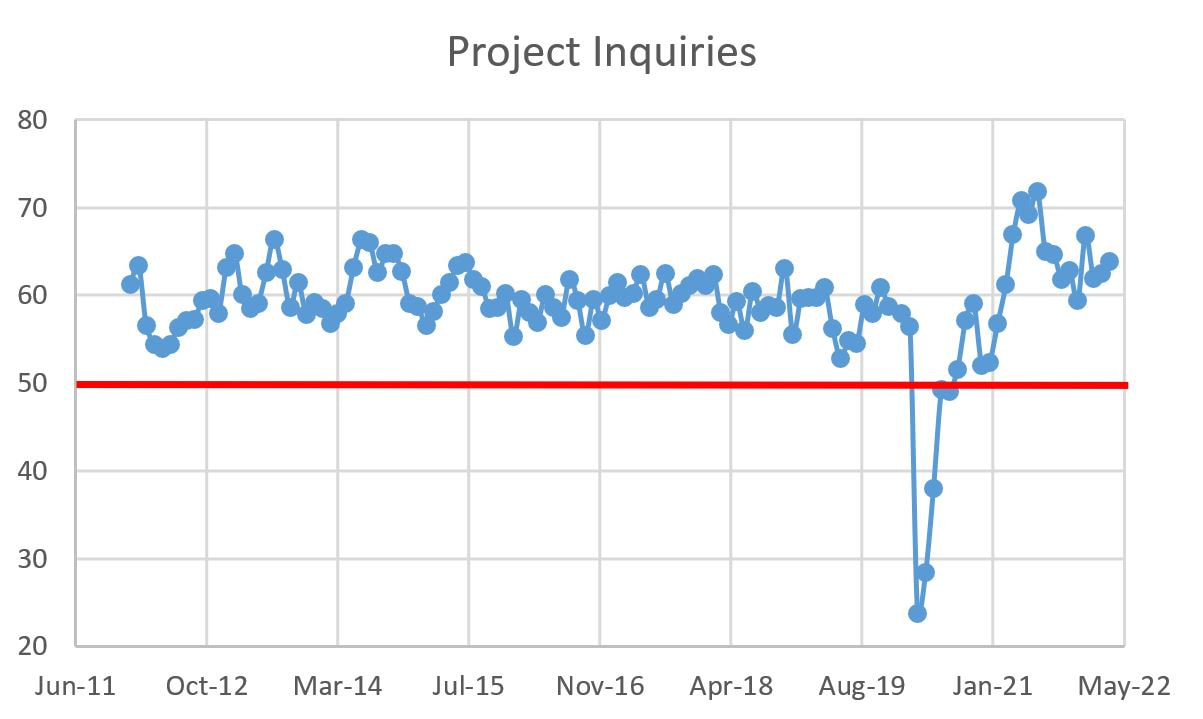 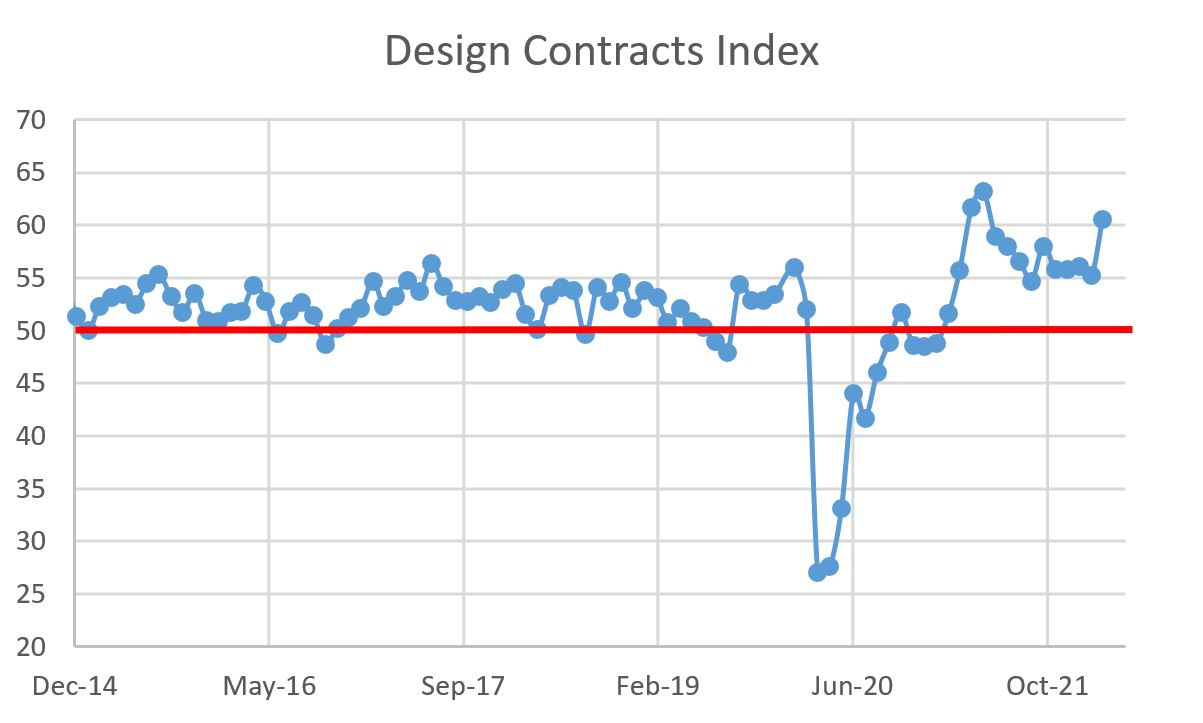 Ok, that title is a bit misleading. This month, there was incremental growth in the American Institute of Architects (AIA) Architecture Billings Index (ABI), with February clocking in at 51.3, up from 51 in January. Under the surface, the regional and sector numbers show a lot of volatility with some big swings up and down. But first, a reminder that the ABI is a nine-to-12 month leading indicator of commercial construction activity, with values greater than 50 signifying increasing design billings and values less than 50 signifying a contraction. Based on the general economy, it should be no surprise that the granular ABI figures are volatile. Last month, I mentioned headwinds facing the AEC industry like material price escalation and a general lack of labor. February looked over at January and said "hold my beer" and introduced a war in the Ukraine that is leading to skyrocketing fuel prices (over $6/gallon in California!). So the fact that we saw any increase in the overall ABI is astounding, not to mention a 5% increase in multi-family (the housing crisis seems to be the only constant) and a nice 3.3% jump in the Midwest. However, the B-side to those gains are sharp drops in Mixed Practice (-9.3%), Northeast (-5.3%) and the South (-4.2%...but don't cry for them or their still lofty regional ABI figure of 58.6). The details are below, but overall, the design and construction industry is still chugging along. 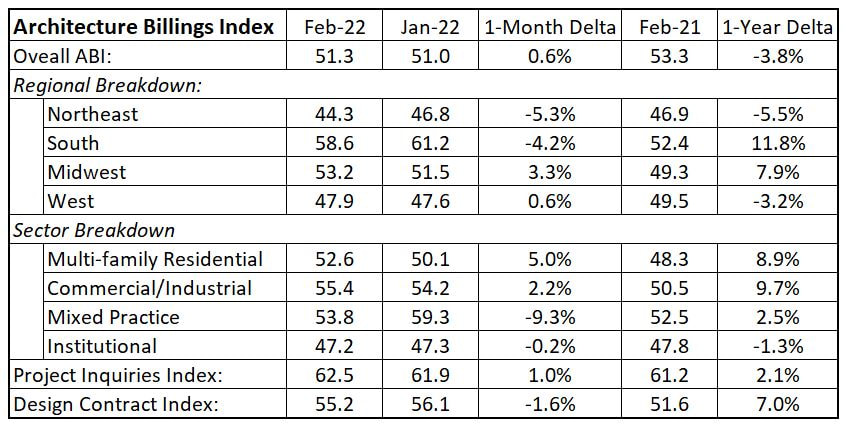  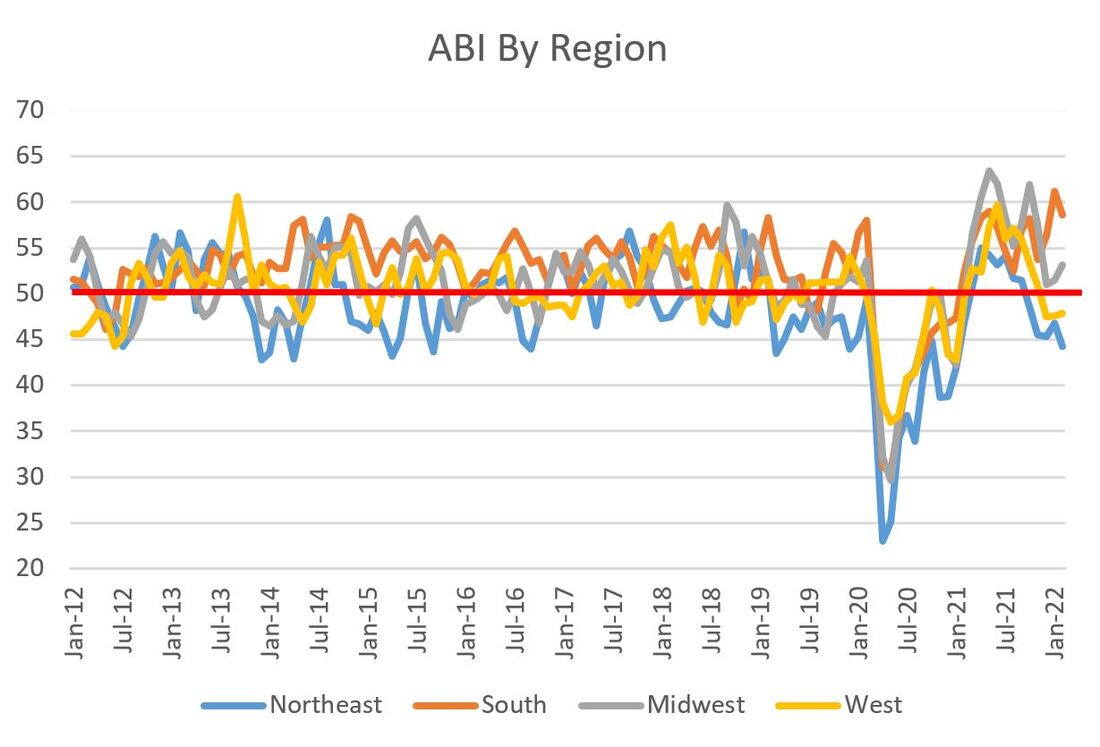  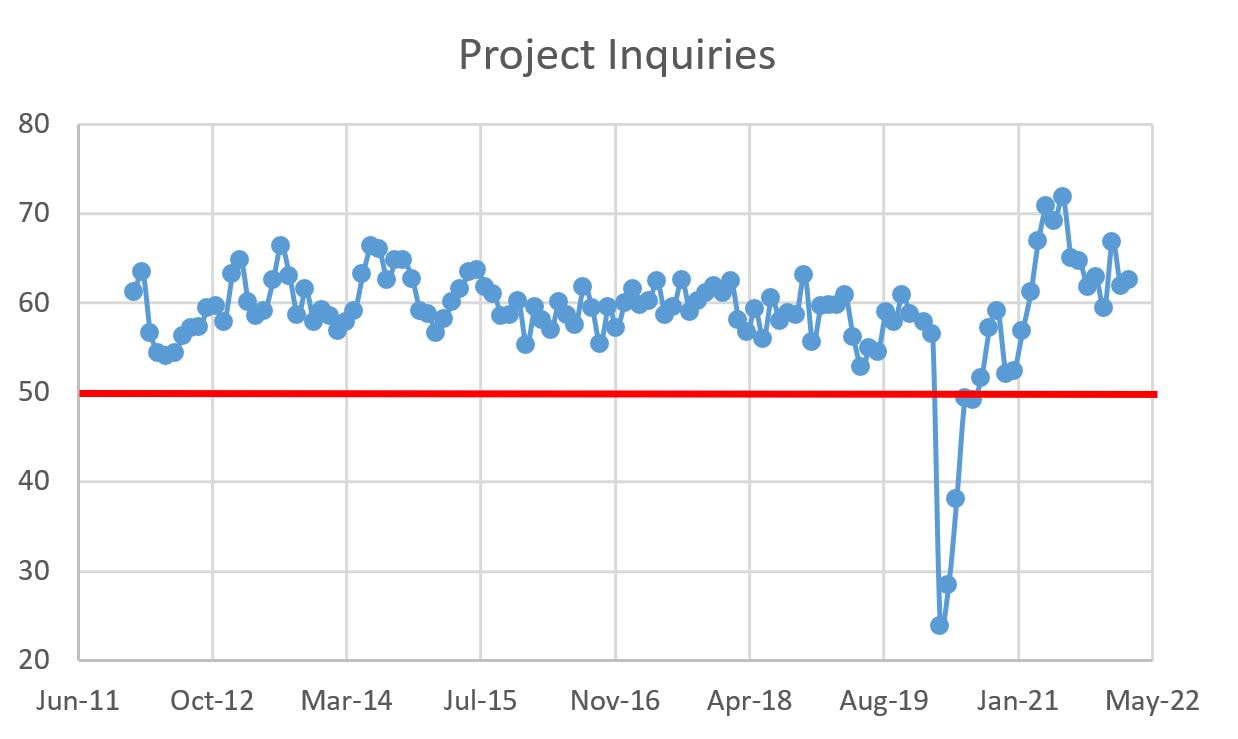  Hello 2022! This is the first construction economics post of the new(ish) year because I put my energies last month into my 2022 Construction Financial Management Association (CFMA) economic forecast presentation (which can be found here). We are off to a good start in 2022, with the Architectural Billings Index clocking in at 51. The American Institute of Architects (AIA) publishes the Architecture Billings Index (ABI) and values greater than 50 constitutes that architecture billings are increasing, while a value less than 50 means billings are decreasing. The ABI is a nine-to-12 month leading indicator of commercial construction activity. Since 51 is (checks notes) greater than 50, billings grew in January. Yay...sort of. January was down from a measure of 52 in December. Per the press release issued by AIA: “Architecture billings, while remaining at very healthy levels in recent months, have slowed considerably from the middle of last year,” said AIA Chief Economist, Kermit Baker, Hon. AIA, PhD. “This no doubt reflects delays in the construction sector caused by supply challenges for both labor and materials, as well as ongoing staffing constraints at architecture firms.” So many of the know headwinds in the industry, such as material cost escalation and a lack of labor, are starting to take root and have negative consequences. The big outstanding question is whether or not this downward trend will continue such that we see a contraction in ABI which would predict a slowing in construction starts. In the meantime, let us just enjoy that the market is healthy and that the ABI is a tick above its average dating back to 2012 (50.9). In particular, take a look at where we were one year ago; in every category except Project Inquiries, the granular ABI figures are up by over double digits. The breakdowns are below in a new table format (with the historical graphs in tow). I hope you like this new format. 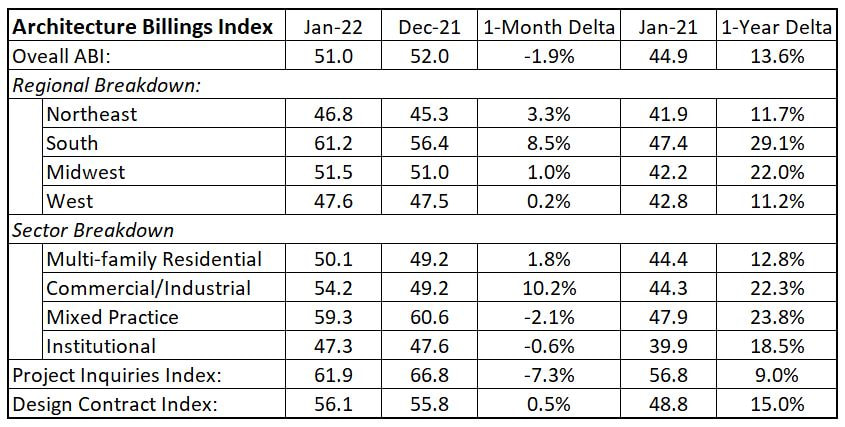 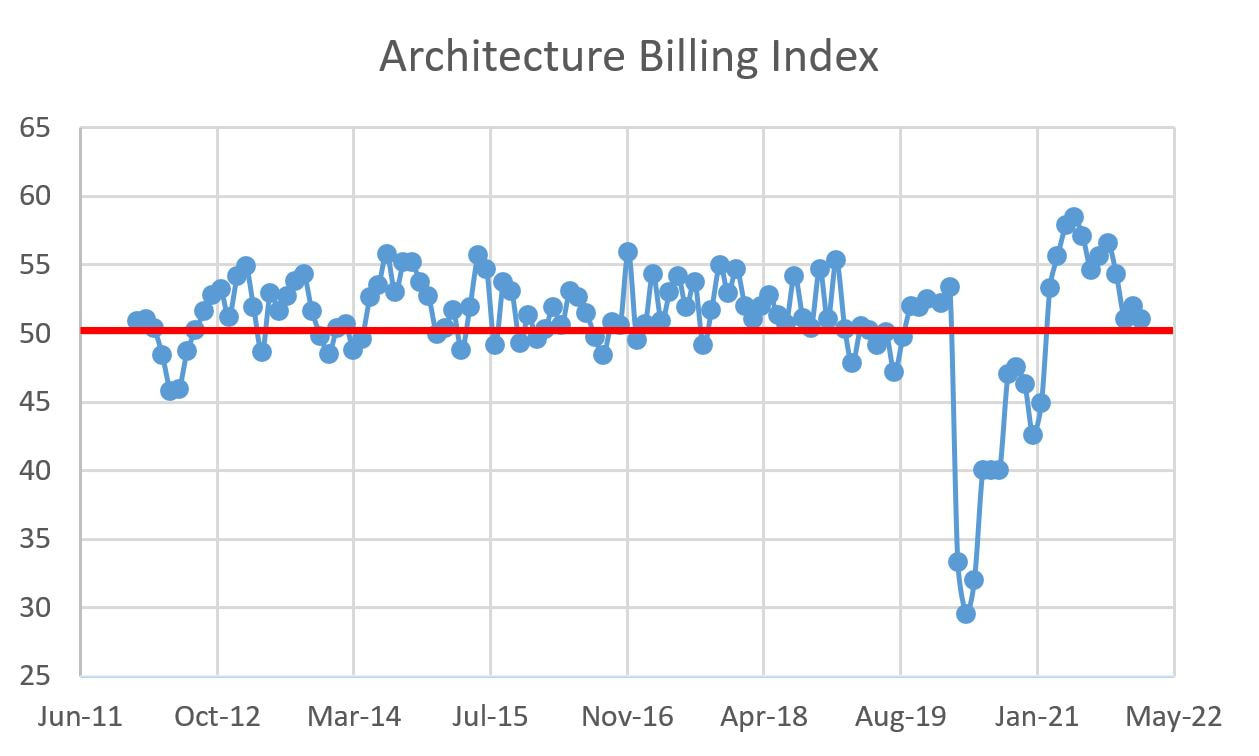 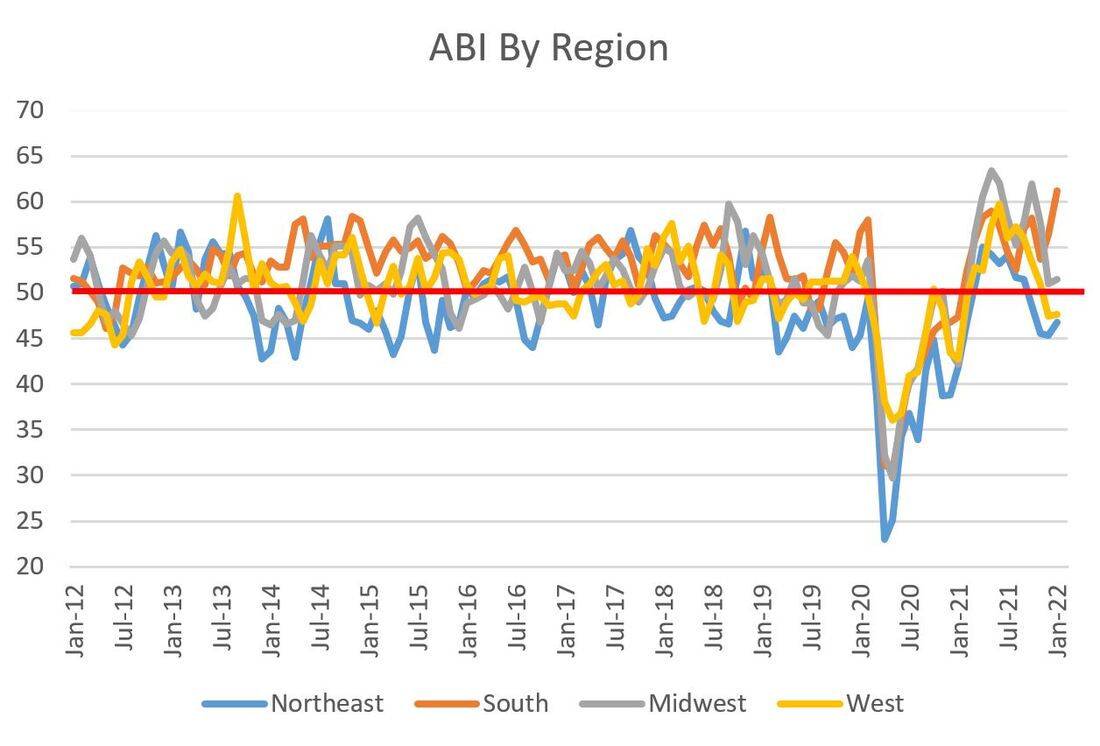 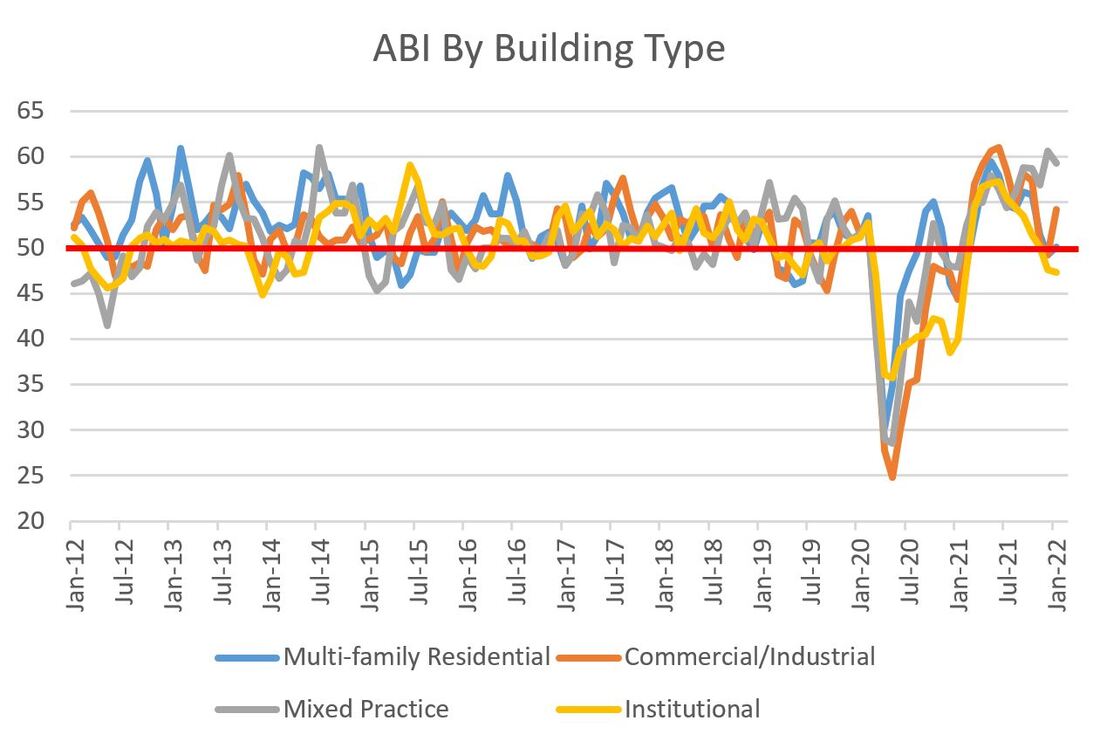  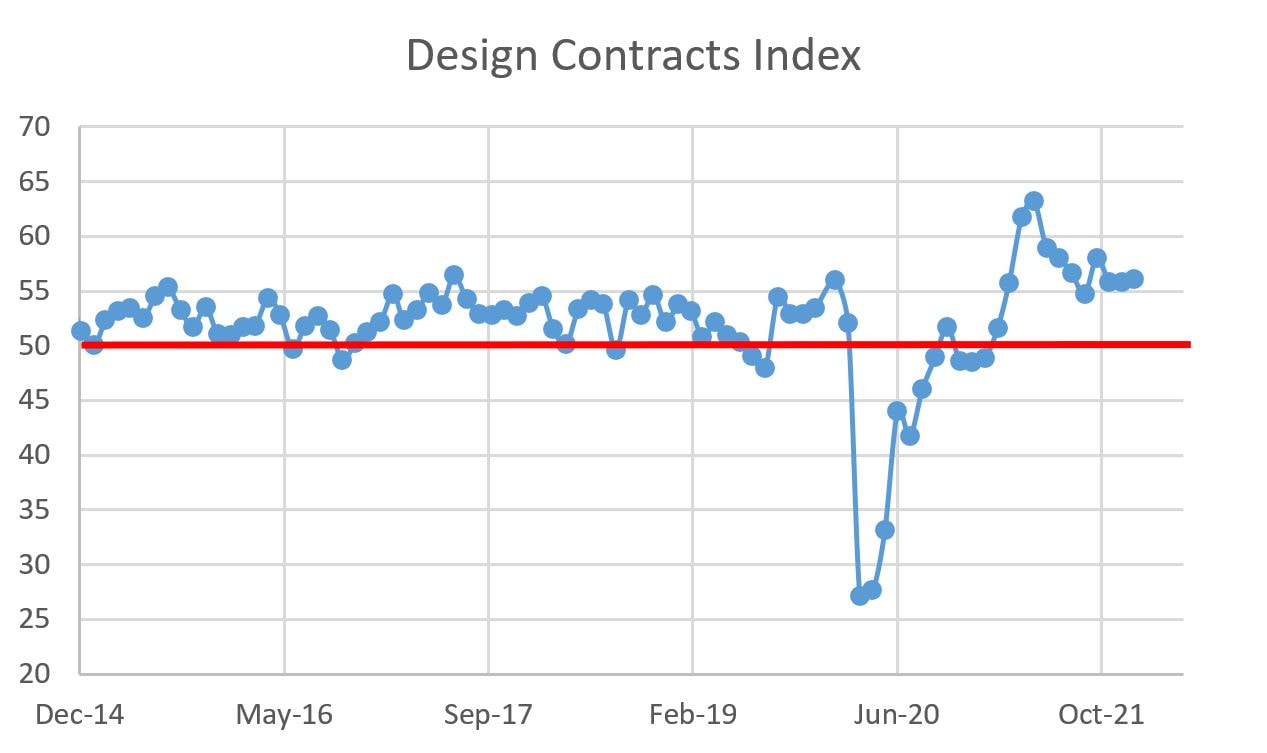 This will likely be the last post of the year and the news is good-ish. The good lies in that architectural billings increased in November, as the American Institute of Architects (AIA) Architecture Billings Index (ABI) for November came in at 51. A value greater than 50 means that architecture billings are increasing, while a value less than 50 means billings are decreasing. We care about this because the ABI is a nine-to-12 month leading indicator of commercial construction activity. Spoiler alert: construction will remain largely busy for the next year. The caveat lies in that the ABI has declined two months in a row and has been on a downward trend since July. This is no reason to panic. In fact, a *moderate* slowdown may be a welcome change from the frenetic pace the AEC industry has been on for most of 2021. Also, this may be the industry adjusting from some serious economic headwinds, chiefly a represented by abnormally high inflation in materials and wages and a woeful supply of skilled labor. Usually that cocktail would lead to a dramatic slowdown, yet we are persevering. The questions is for how long? 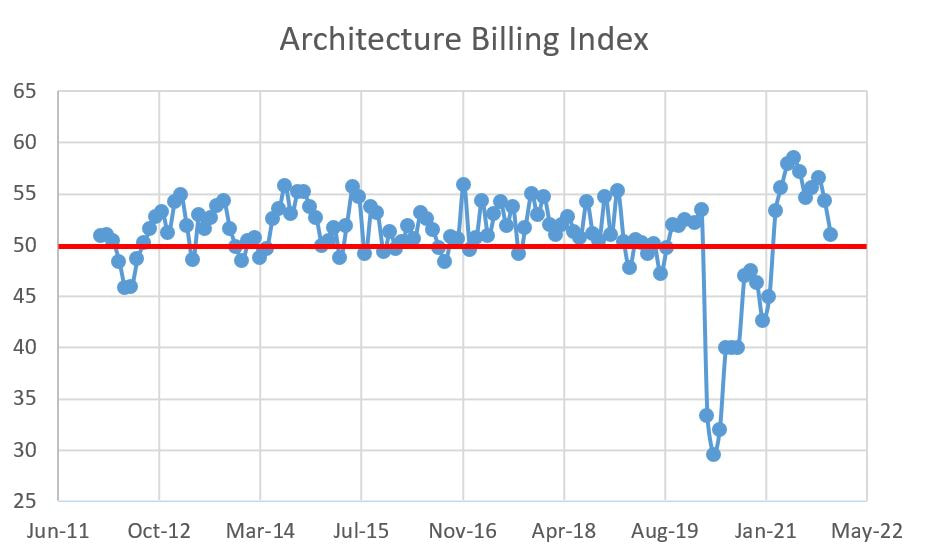 Similar the the overall ABI number, the regional ABI readings all declined. But since this is the holiday season, let's stay positive: three of the four regional values clocked in above 50.
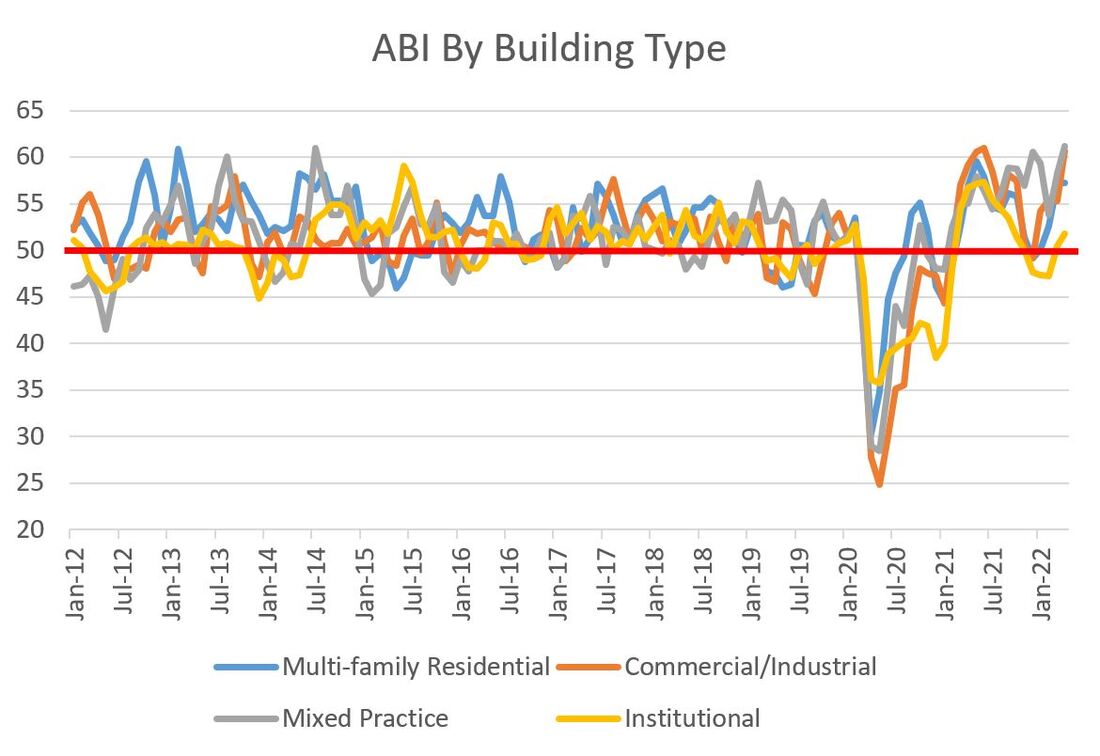
 The story is similar for industry sectors in that all ABI values declined from the previous month, yet all are still above 50. This means the billings are growing across the board, albeit at a slower rate than the previous month. All in all, this is good news.
 Project inquiries and design contracts also fell from October, but both are well above 50 and their 199-month averages, so we will finish on that positive note. I hope everyone has happy and safe holidays! 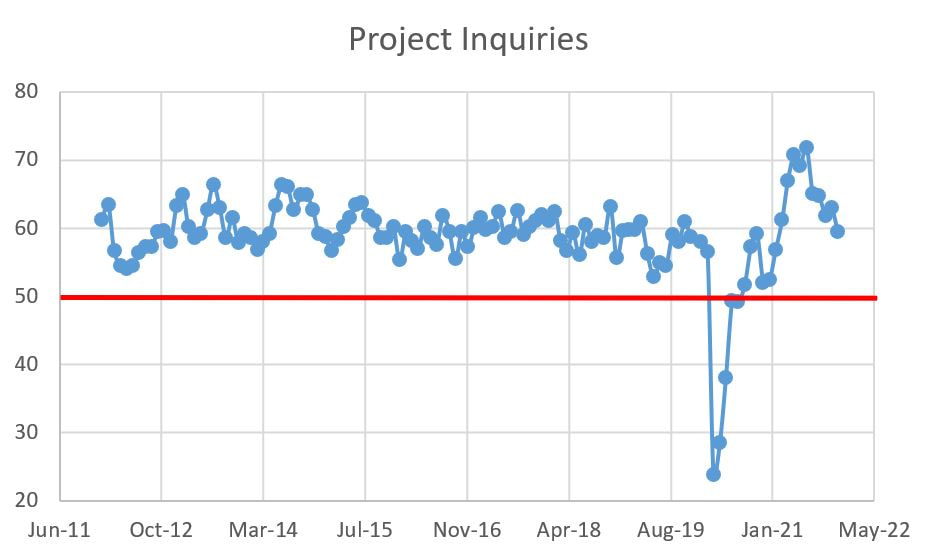 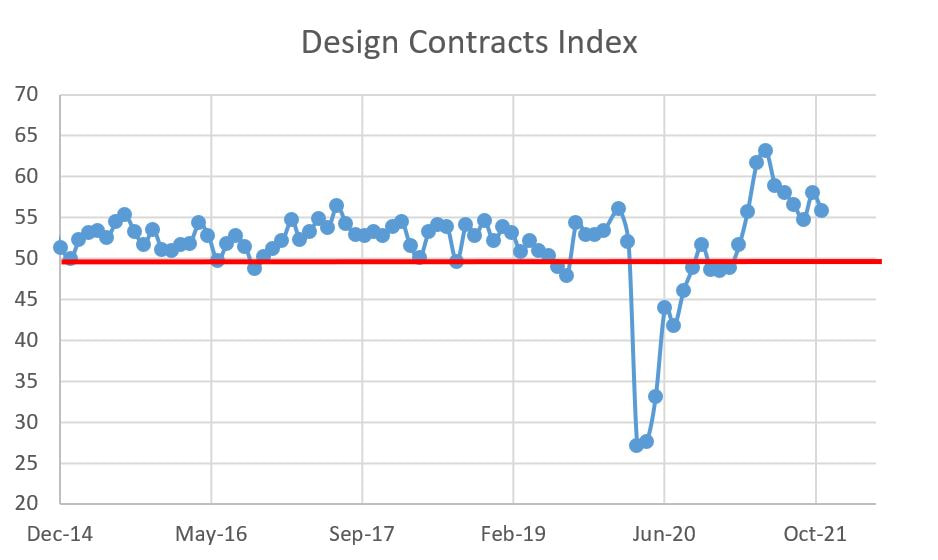 |
Archives
January 2024
Categories |
 RSS Feed