|
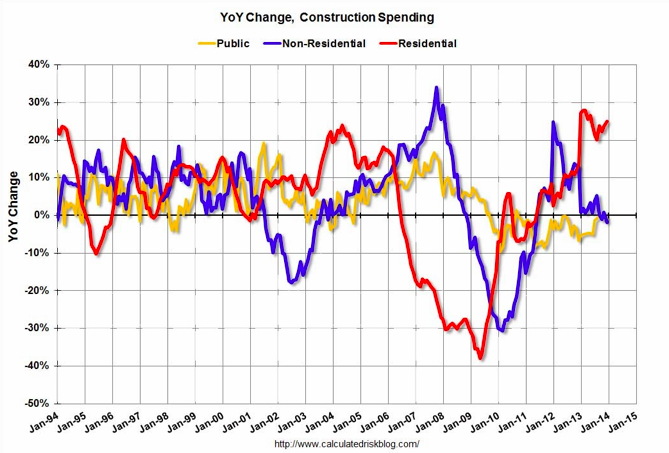
The U.S. Department of Commerce's Census Bureau reported yesterday that construction spending for February increased 0.1% to $945.7 billion above January's revised value of $944.6 billion. Increases were seen in private construction ($680 billion in February, up from $679.1 billion in January) and public construction ($265.7 billion in February, up from $265.5 billion in January). Those gains might seem small, but they're month-to-month increases. The real story is in year-to-year growth. On that basis, private residential construction is up 14% and non-residential is up 12%. Public construction is still weak and down about 2% year-over-year. The figures below from Bill McBride at the Calculated Risk blog do a great job of showing how we're still way off from the bubbly highs of the mid 2000s but up strongly from the bottoms at the beginning of the 2010s. 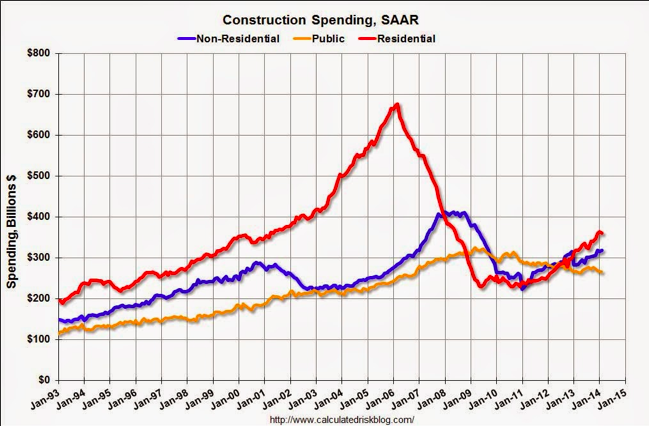
I agree with Bill in that these gains in construction, along with the increases in the AIA's Architectural Billing Index, shows that the construction industry is getting stronger. The ABI is increasing for commercial construction (read about it here) and will continue to improve as more people find employment and spend money. Private residential tends to lead the economy, so strength in that segment is good news.
0 Comments
Earlier today, I wrote about how the AIA ABI is showing continues strength in the multi-family commercial construction segment, but also how the commercial/Industrial segment is improving as well. Not a few hours later did I come across the following article stating that non-residential starts are down for the third month in a row. Some of the data from that article is displayed below: 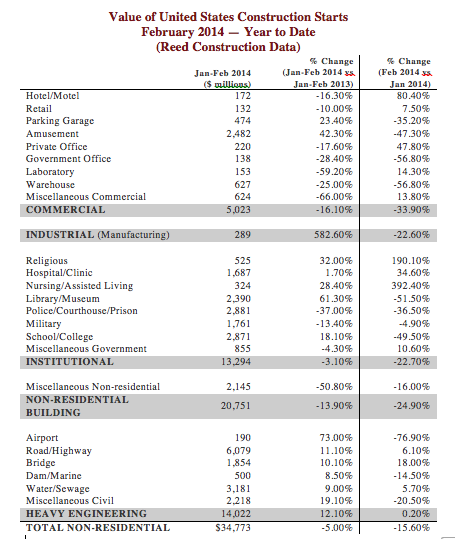
So what gives? My take is that the AIA ABI is a leading indicator which typically predicts construction activity nine to 12 months in advance (it's a measure of architectural billings, which occur well in advance of actual construction), while construction starts are a more contemporaneous measure of construction activities (usually within the past month or so). The winter was particularly brutal on the east coast and midwest, so construction starts were slowed, but that bad weather may not have had the same negative effect on architectural billings. In sum, it will take a while to know exactly how the economy is doing, but hopefully ABI (forward looking) trumps starts (backwards looking) as a predictive indicator of the health of the construction industry.
I just read this article exclaiming "Nonresidential Construction Materials Prices Tick Higher in January." But the title is a bit misleading. Sure, the article says that there have been large recent price increases in cement, natural gas, iron and steel, copper, and architectural metalwork. Ok, that's important and those are key materials for construction. But later, the article states that there have been large price decreases in diesel fuel, asphalt, nonferrous pipe and tube, and construction equipment and leasing. Doesn't this indicate that the price of construction materials is a mixed bag? The key for contractors is to regularly check market prices for commodities and materials as to be aware of the price changes and make sure they account for them in their bids as necessary.
Somehow buried in the article is the slight mention that construction downside risks have fallen. This, to me seems important. The article states that the major risks facing construction economics, albeit small, are issues stemming from a tapering of quantitative easing, debt default in a (none in particular) European country, and a (none in particular) European country exiting the Euro. My favorite leading indicator of soon-to-be construction activity was just released. The AIA ABI figures for February 2014 were just posted and there was another slight improvement, from 50.4 in January to 50.7 in February, for the aggregate nationwide number, which is great. Any value greater than 50 means that architecture billings are increasing; architecture billings are a nine to 12 month leading indicator for construction activity. But the devil is in the detail, which are shown below:
Regional Averages for February 2014:
That last value is of particular importance to me because most of my students work or will work on the west coast. While certain regions (San Francisco/San Jose Bay Area) are still very strong, the recovery elsewhere has been slow to materialize, if there even is a recovery. Hopefully this turns around soon. Sector Averages for February 2014:
As has been the case for several months, the multi-family residential market continues to pace commercial construction. In talking to contractors that serve this market, it sounds (anecdotally) that there is still room to grow, with one contractor in particular telling me that they are beginning to turn work away because their backlog is bursting. The increase in commercial/industrial is also promising. Project inquiries declined to 56.8 from 58.5 in January and from 59.2 in December. Multi-family continues to drive the construction industry. Based on my previous post, hopefully It's that time of month: the American Institute of Architects just released the most recent Architectural Billings Index (ABI) figures for January. The good news is that they're up from Decembers retreat, increasing from 48.5 to 50.4 in January. Any value greater than 50 means that architecture billings are increasing; architecture billings are a nine to 12 month leading indicator for construction activity. Here are the particulars:
Regional Averages:
Sector Averages:
Project inquiries declined to 58.5 from 59.2 in the previous month. Multi-family continues to drive the construction industry. Based on my previous post, hopefully Housing starts declined from 1,048,000 in December 2013 to 880,000 in January 2014. While multi-family starts are more volatile on an month-to-month basis (see figure below from Bill McBride at the Calculated Risk blog), both single and multi-family move together. This downturn in starts coincides with a sharp decline in house-building permits, which are experiencing their longest downturn since the collapse of Lehman Brothers in 2008. 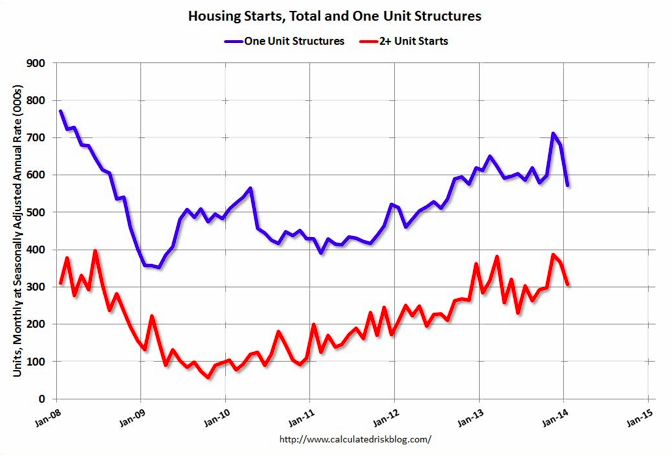
Construction activity is up nationwide, but it's mostly concentrated in the residential market. Here are the highlights:
Private residential construction tends to be a leading indicator while private nonresidential tends to lag the economy. If this continues to hold, then the current data may provide clues that 2014 will be a better year for the construction industry. Public construction is off it's recent lows, but it has been on a downward trajectory for four years. Multifamily housing has been particularly strong. According to CoreLogic: "..the strongest multifamily markets have been driven by traditional fundamentals. Panelists at the [National Multifamily Council’s Apartment Strategies] conference singled out San Francisco, San Jose, Calif., Denver, Austin, Texas, Seattle, Wash., Dallas, Texas and Houston, Texas as the most currently robust multifamily markets. Combined, these markets have an employment base growing by 2.6 percent, a full percentage point faster than the U.S. rate – a very wide gap. Moreover, these markets also have strong demographic growth, driven in part by the job market, especially in technology and oil, which has attracted in-migration from other states and internationally. The conference consensus was that the current multifamily cycle will outlast prior average cycles given that the multifamily market under-built during the boom in the mid-2000s, but still had large declines during the bust. For more analysis, check out this recent Calculated Risk post and associated graphs: 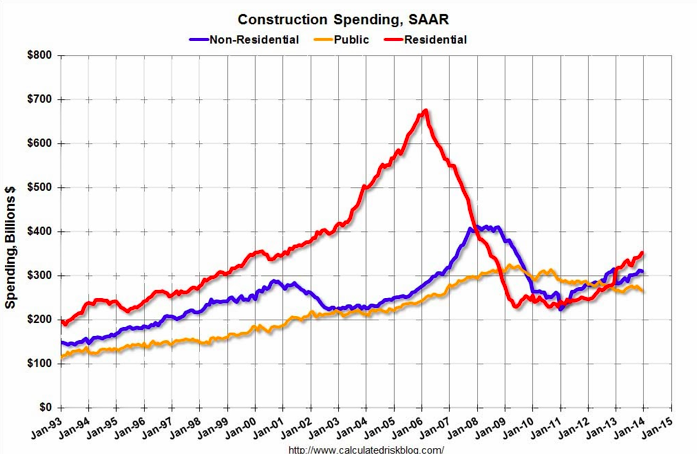
The title shows my west coast bias and how I don't want most (all?) of the people who read this to panic. Things are OK on the west coast (particularly in the Bay Area). The real headline from the American Institute of Architects (AIA) is that the Architectural Billing Index (ABI), a leading indicator for construction activity by nine to 12 months, is down for consecutive months for the first time since May to June 1012. It fell from 49.8 in November to 48.5 in December 2013. Any figure below 50 shows a contraction in architectural billings (and hence, less building construction down the road). The 48.5 figure for December represents the total U.S. building market as a whole. Breaking the number down by region and sector type tells a nuanced story: Regional averages:
Sector averages:
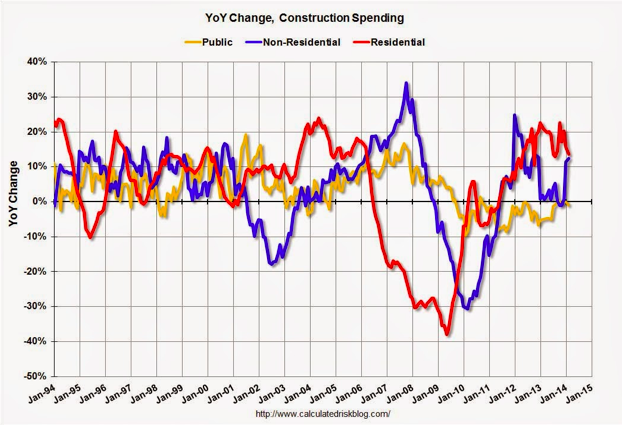
The ABI is essentially being dragged down by the Northeast (and to a lesser extent, the Midwest) and by the Institutional and Commercial/industrial sectors. The AIA's Chief Economist, Kermit Baker, states part of this overall decline in ABI this may be hangover affects from the Federal government shutdown last year. I buy that, particularly for Institutional projects (schools, college campuses, corrections facilities). But it doesn't explain why the West is showing continued strength. My hope is that things are just temporaily slow in the Northeast and Midwest due to the harsh winter and people working less. I guess we'll find out in the spring. Commercial construction continues to face headwinds in retail (malls are dying a slow death) and office (relatively high unemployment means less need for offices). One last thing: building construction is highly dependent on local markets. Some cities are up, others are down. Same goes for sectors. This adds to the volatility of the regional numbers, which snowball into volatility in the national number, as the figure below from Bill McBride at the Calculated Risk Blog so elegantly demonstrates: 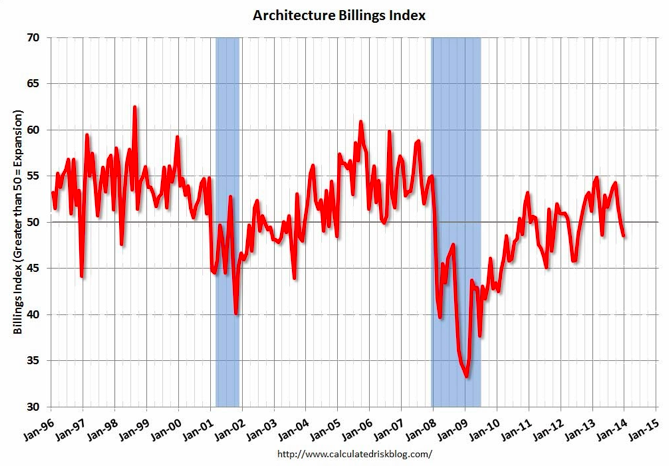
The recent slide in ABI is not encouraging, but keep it in perspective. The design/construction is volatile, and it's more important to keep an eye on your respective market.
To read the full AIA press release, click here. Total single-family home sales were down 20% in Sacramento from December 2012 to 2013. Cash buyers for home accounted for 19.5% of all sales, down from 25% a year ago. The inventory of homes increased 44.2% year-over-year in December. Sounds like bad news, right? Supply is up and demand from cash buyers, seemingly the best kind, is down. But trow into the mix that conventional sales (those where your typical buyer takes out a conventional mortgage) were up in December 2013 over the previous December and you have signs of a healthy housing market. Cash buyers are typically investors looking to rent homes. Conventional buyers signal improving consumer sentiment, a precursor to a recovering economy. The increase in inventory leads to slower price increases (with more options of houses to buy, purchasers have some leverage over sellers, keeping prices down). All this equates to an improving market in Sacramento after years of distress.
This is also signaled in home builder sentiment. Nationwide, home builder sentiment declined from 57 to 56 from December 2013 to January 2014. Results greater than 50 indicate the degree that builders feel sales conditions are good. When homebuilders have relatively higher sentiment, they're more apt to build homes, signaling an improving economy. But let's dig deeper: In the west, sentiment increased four points to 63. Not too shabby. Why does this matter to someone interested in in the construction of large structures? Because single-family home building is a leading indicator for the construction of roads and other infrastructure, schools, retail space, and other buildings. Sacramento has been lagging the Bay Area for some time, but perhaps it's about to break out of its doldrums. For more reading, click these links: The winners:
The big loser:
Read ENR's summary of the bill here. |
Archives
January 2024
Categories |
 RSS Feed